Barcelona is full of cafés. That part is obvious.
What is less obvious is why they appear where they do.
Are cafés mainly following tourists?
Do they cluster around transit?
Do they prefer the busiest streets?
Or are they simply where the most people live?
I wanted to look at this spatially rather than rely on assumptions.
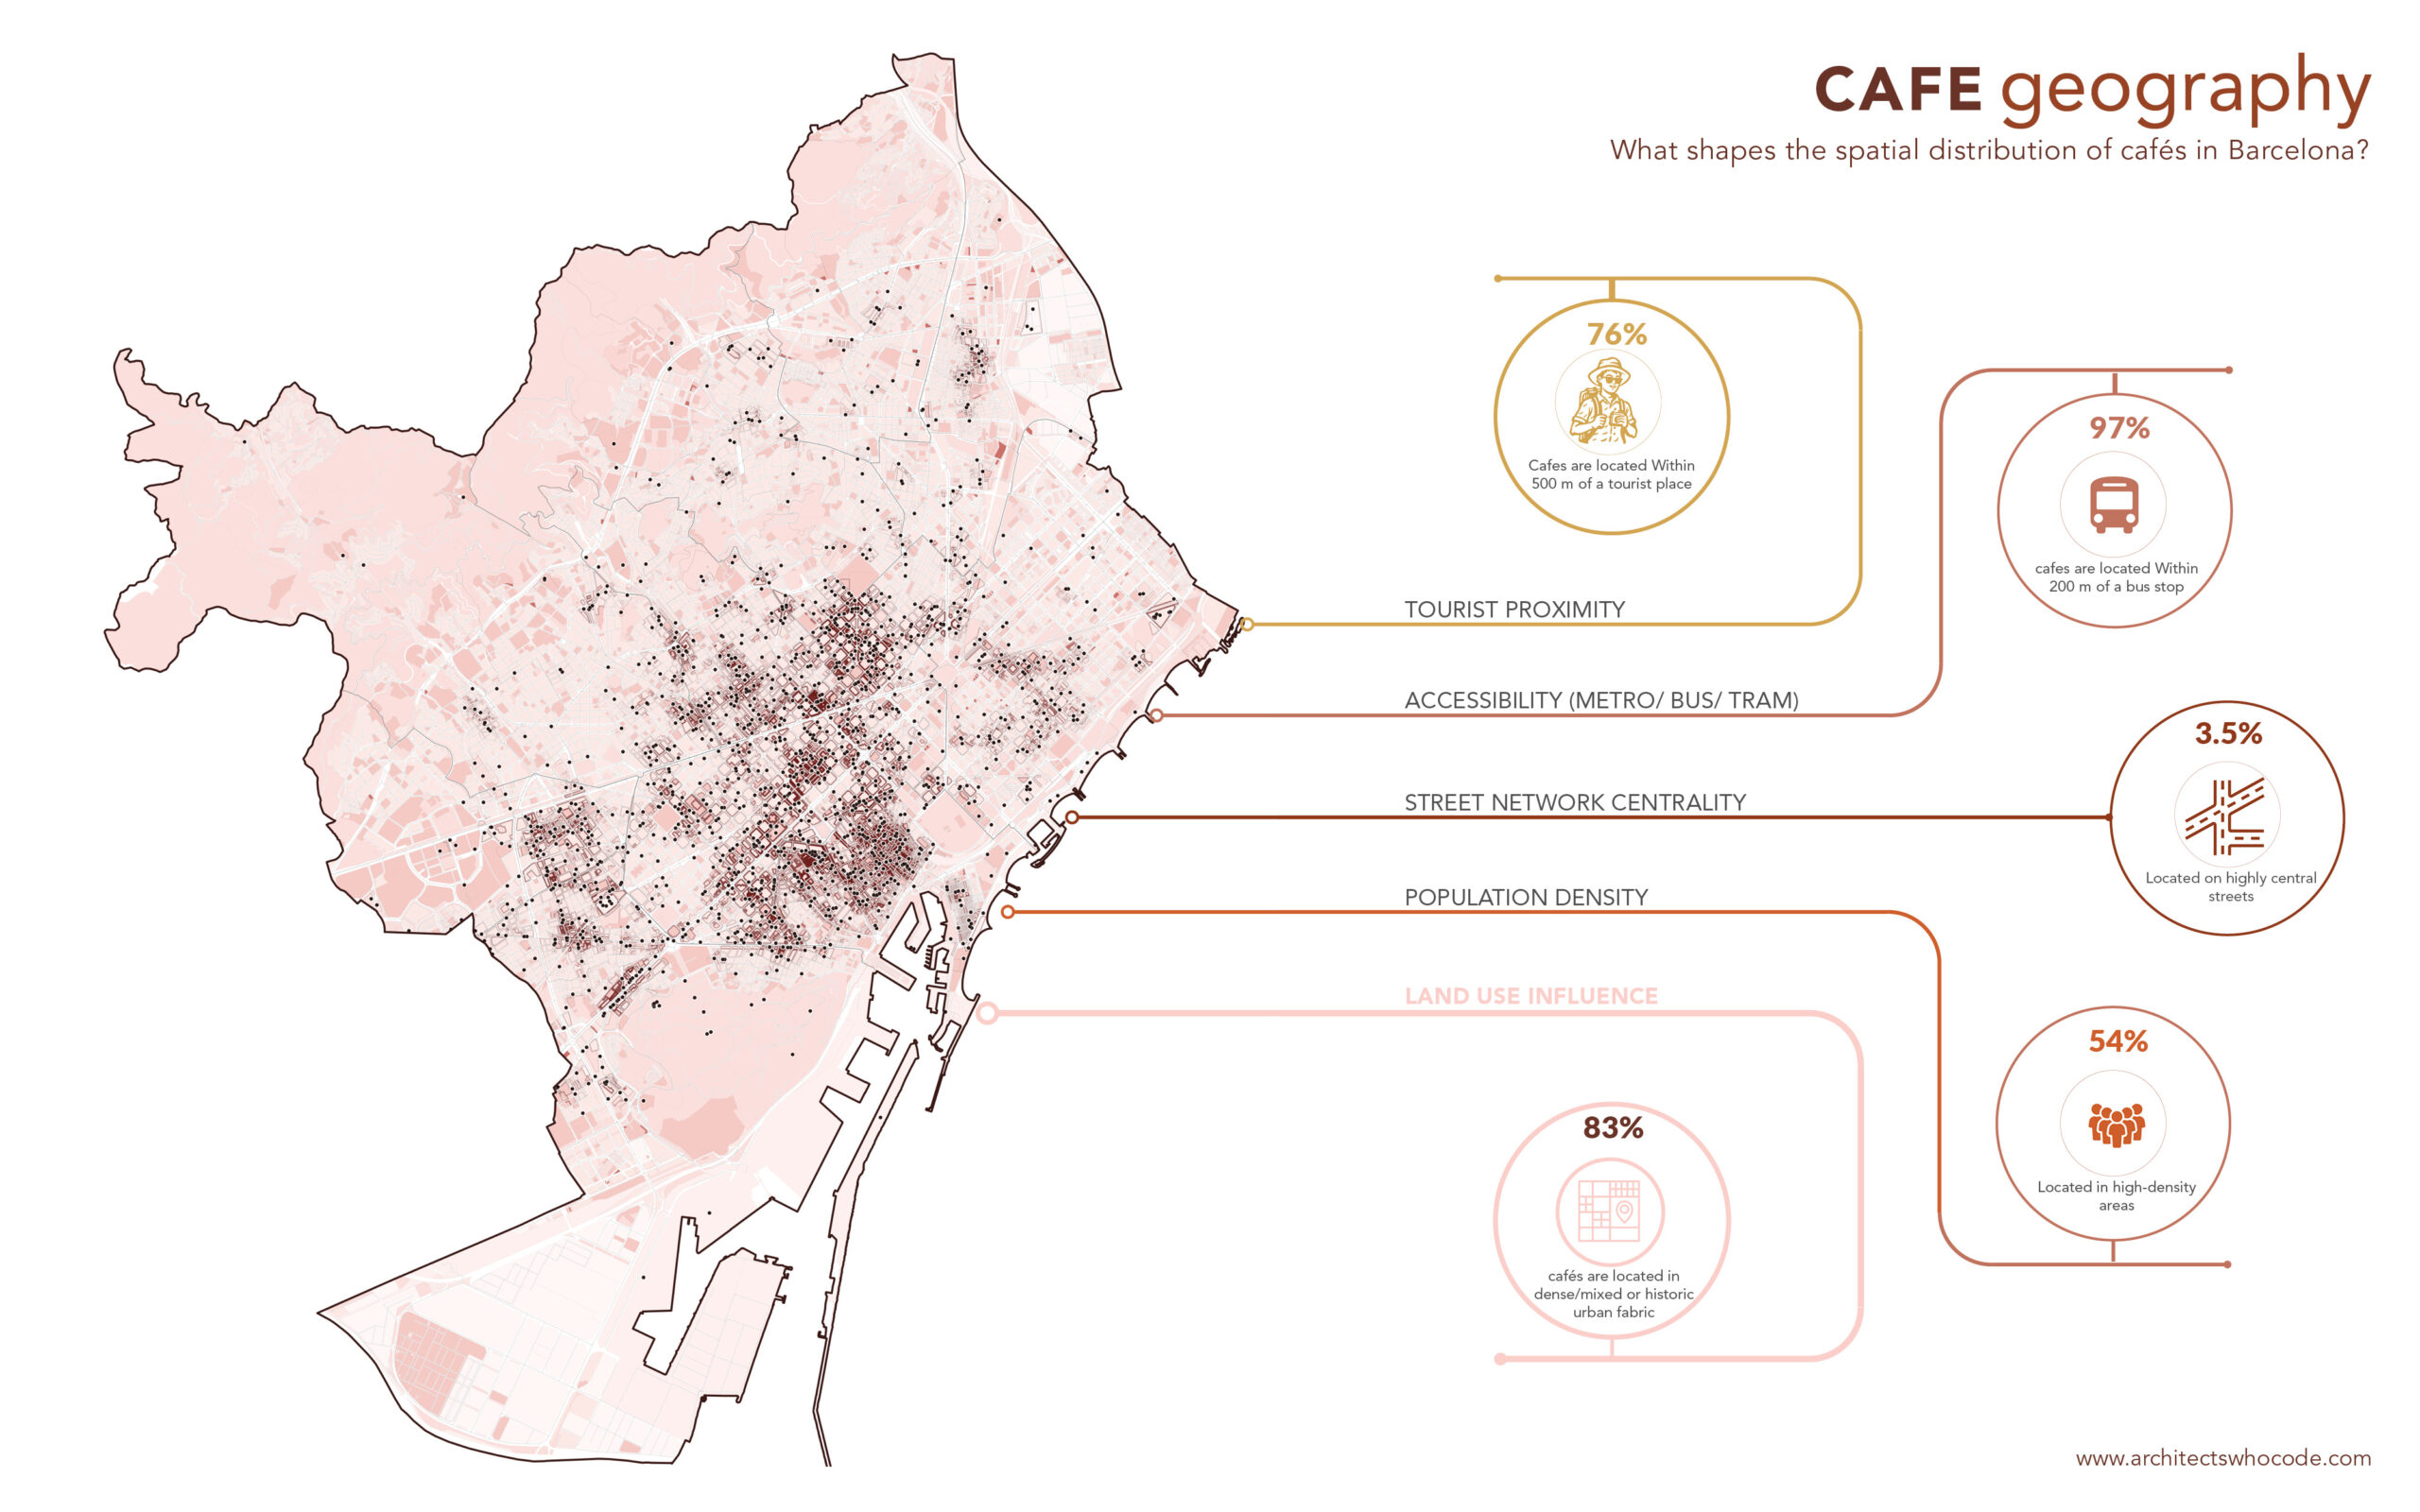
So I mapped roughly 1,500 cafés across Barcelona and compared their locations against five urban conditions:
tourism, public transport, street-network centrality, population density and land-use context.
Tourism: important, but not the whole story
Let’s start with the obvious one.
Barcelona is one of Europe’s major tourist cities, so you would expect tourism to leave a pretty strong footprint on café locations.
It does.
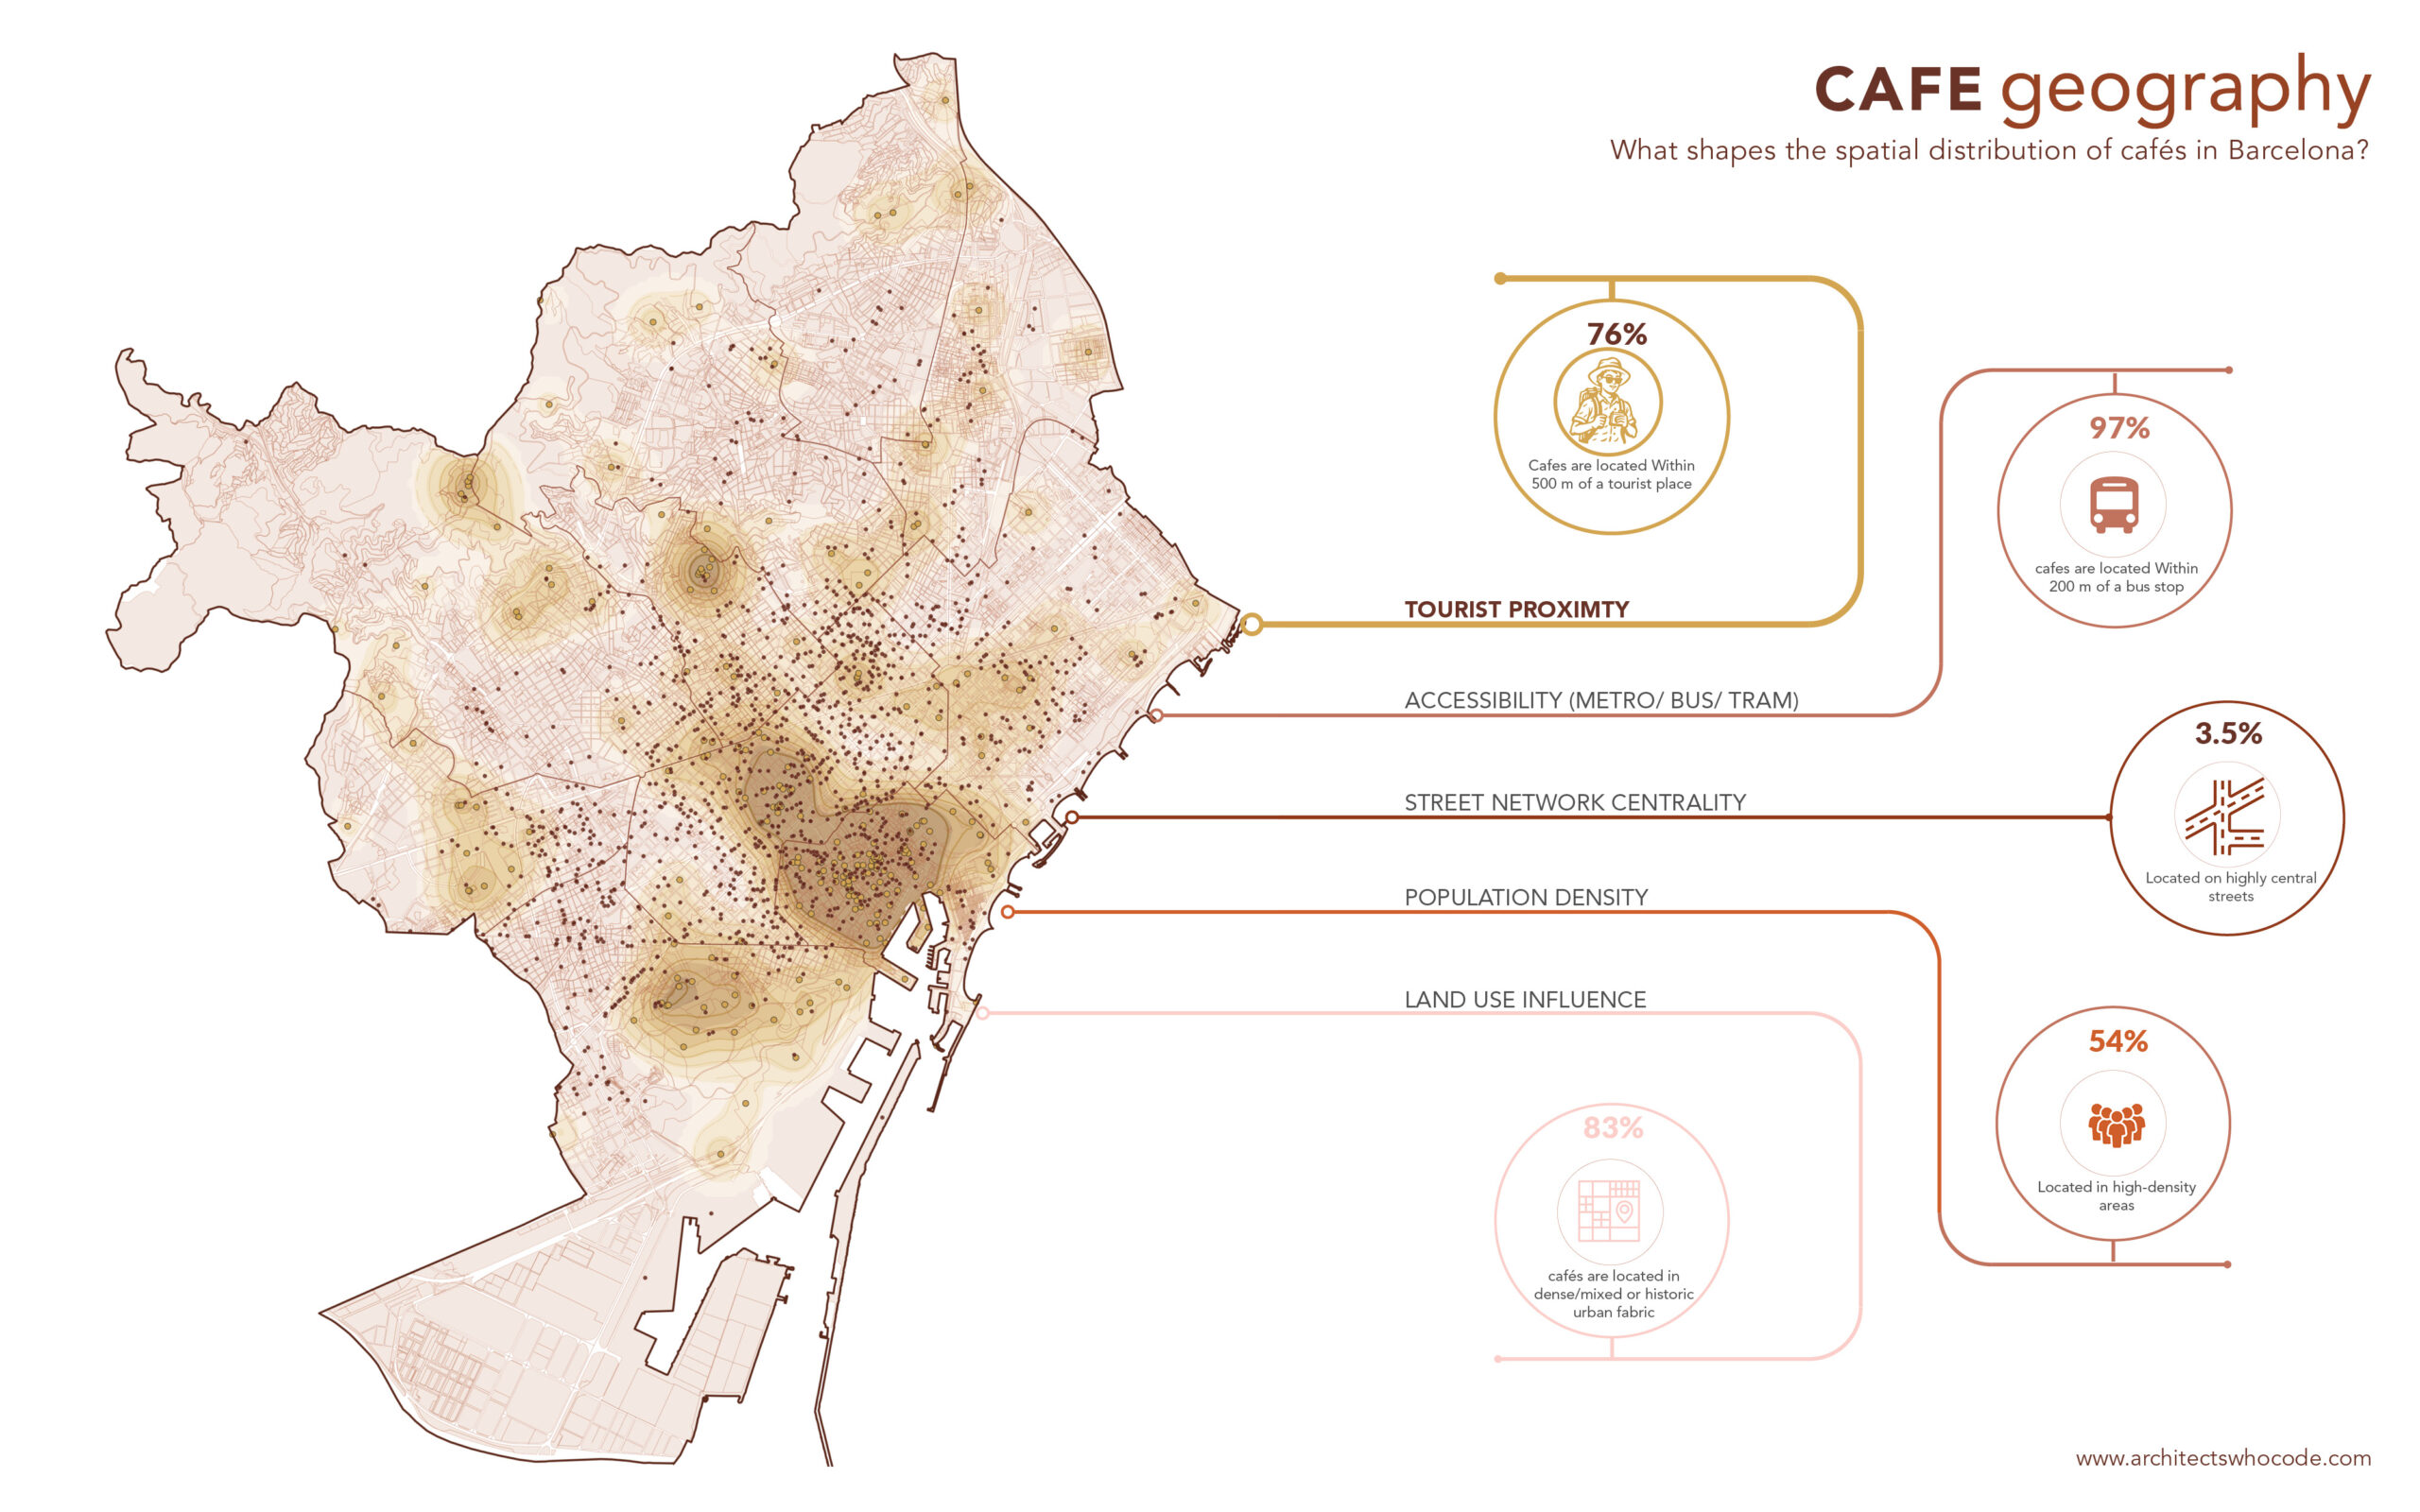
76% of cafés are within 500 m of a tourist place.
The median café was about 303 m from its nearest tourist destination. On the map, this creates some very clear clusters around the historic centre and other major visitor areas.
But cafés do not disappear once you move away from those zones. There are still large café concentrations across neighbourhoods that are much more connected to everyday city life.
So tourism clearly matters, but it is not enough to explain the entire map.
The interesting part is what happens outside the tourist hotspots.
Accessibility: cafés are almost always close to transit
This was probably the least surprising result, but the scale of it was still interesting. I combined bus stops, metro stations, tram stops and railway stations into an accessibility layer.
The result:
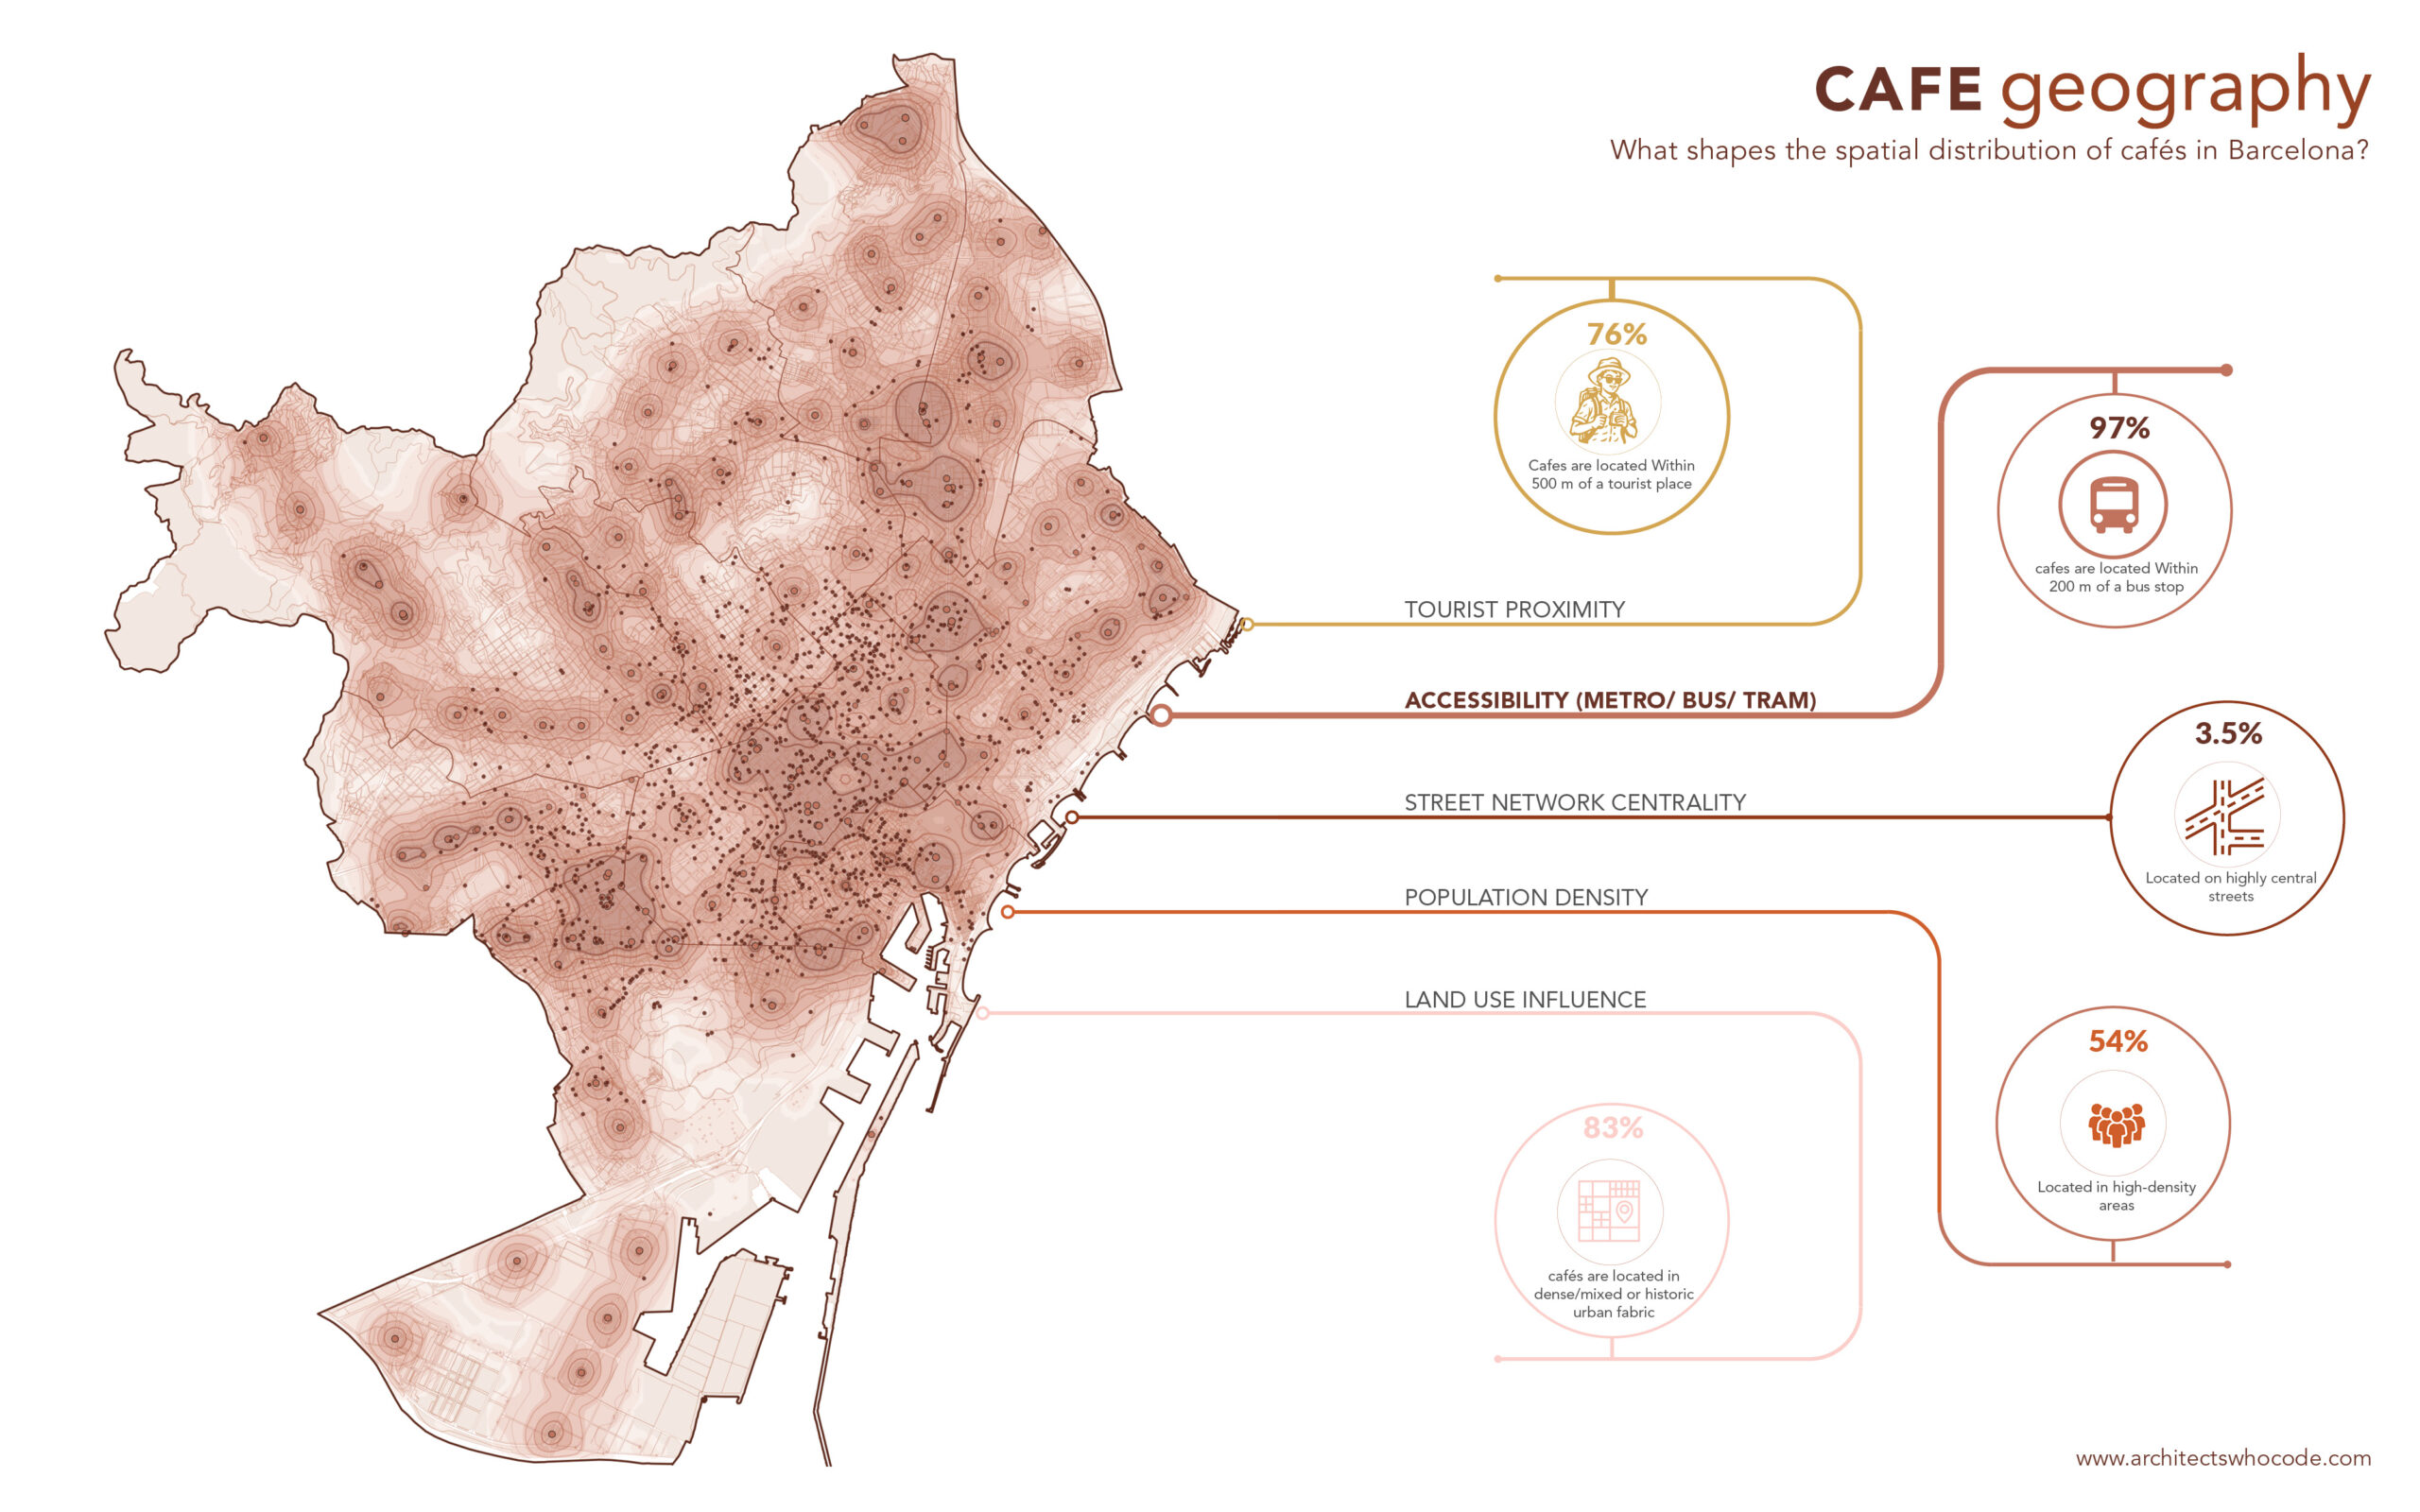
97% of cafés are within 200 m of a bus stop.
The median café is only about 82 m from the nearest bus stop.
That tells us something important about Barcelona itself.
Cafés are not necessarily clustering because of bus stops. Barcelona’s transit network is simply so dense that cafés operate inside a highly accessible urban environment almost by default. So accessibility seems less like a special advantage and more like a basic condition of the city.
Street centrality: this one surprised
I expected cafés to strongly follow Barcelona’s most important streets. They did not.
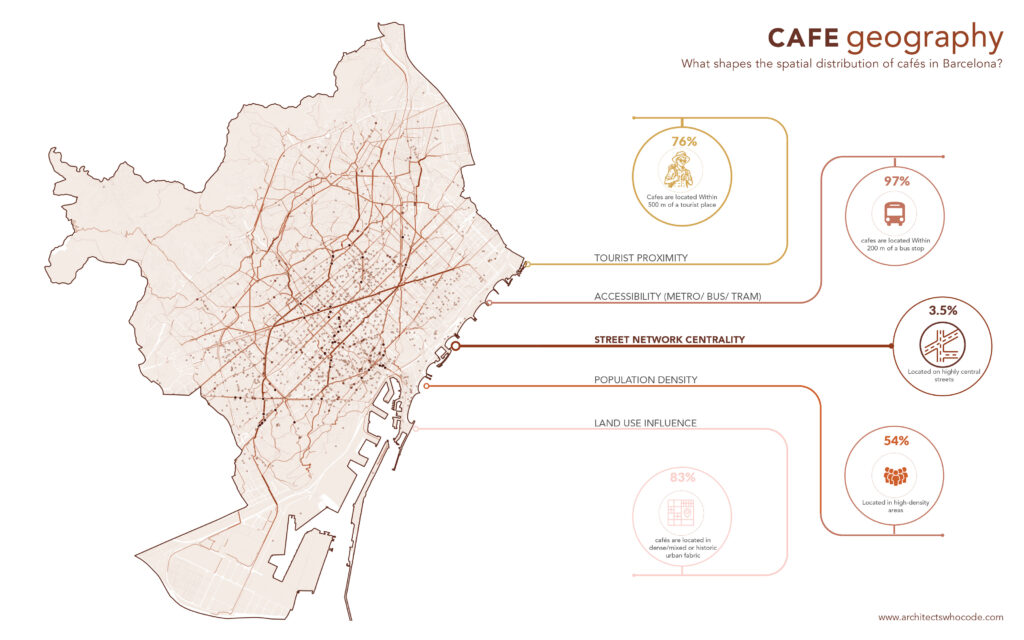
I built a pedestrian street network and estimated centrality by sampling routes across the city. The idea was to identify streets that repeatedly appear as important connections through the network. Then I compared those streets with café locations.
Only 3.5% of cafés were on highly central streets.
Those highly central streets represented around 8% of the analysed network, meaning cafés were actually underrepresented on them. That is interesting because we often equate a “busy” street with a “central” street.
Spatially, those are not necessarily the same thing.
A neighbourhood street can have restaurants, terraces, shops and constant pedestrian activity while still being relatively unimportant to the citywide street network. So cafés may prefer local activity streets rather than globally central ones.
That distinction became one of my favourite findings from the study.
Population: more people does not automatically mean more cafés
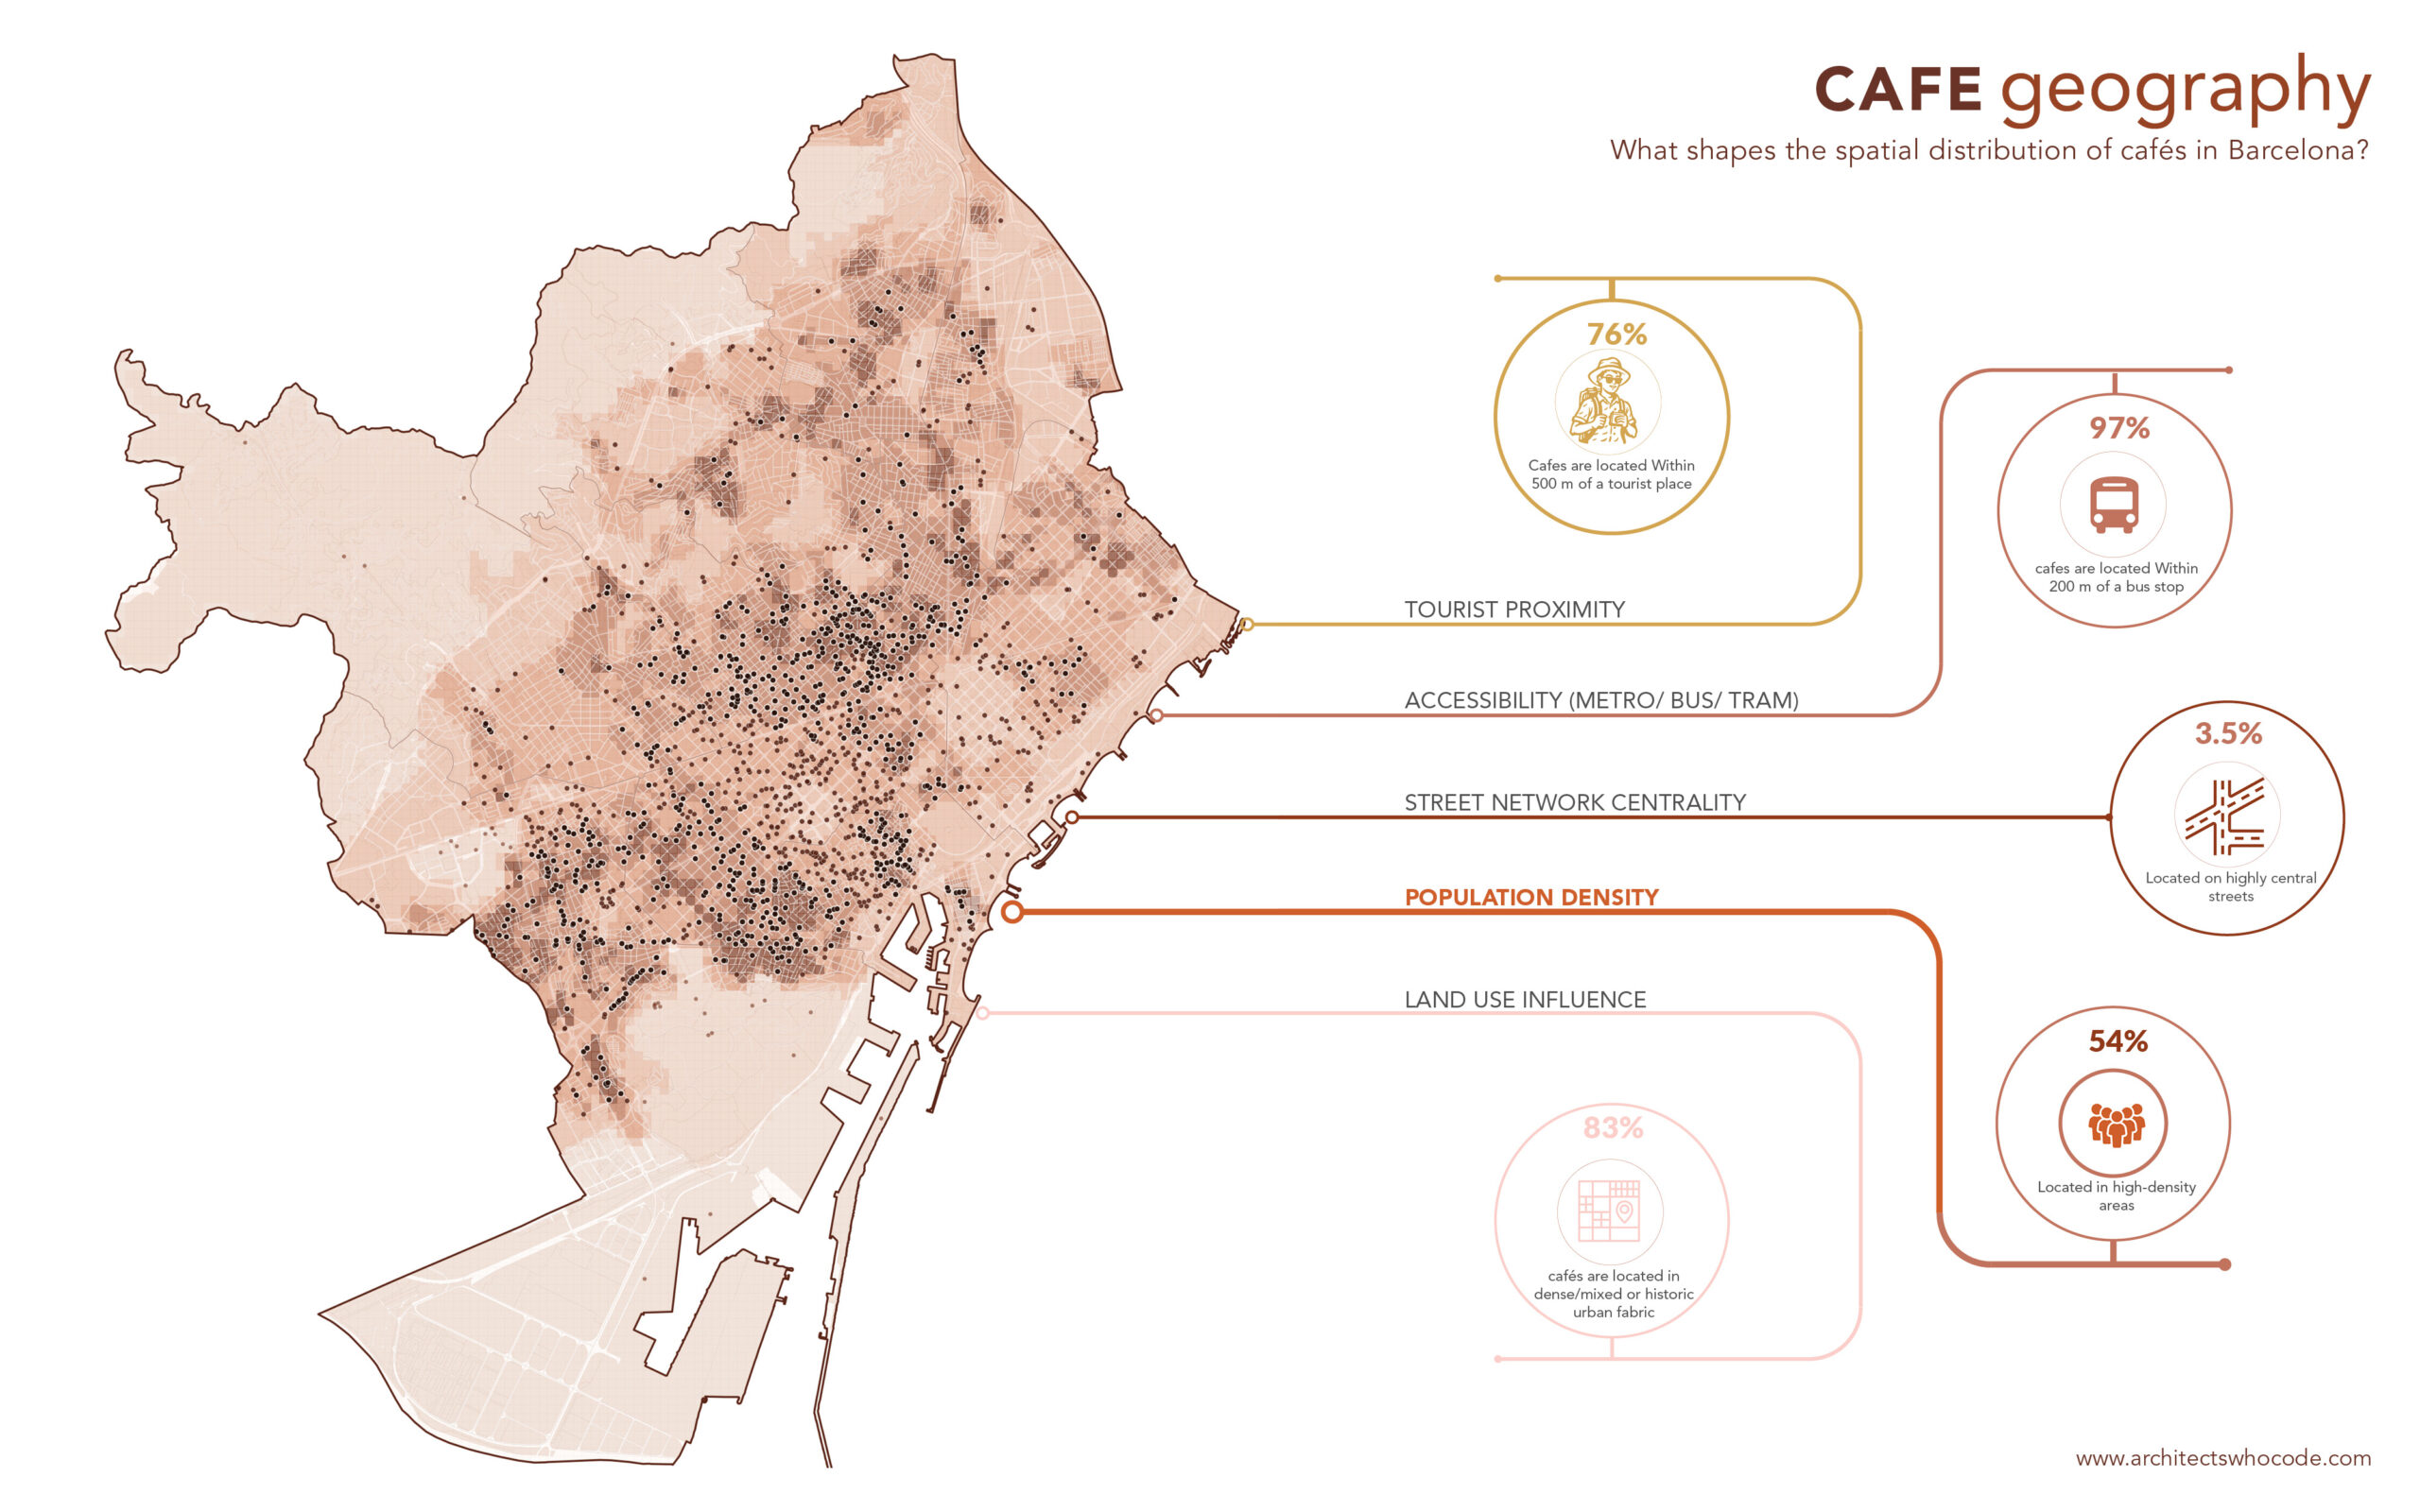
Next came population density. Using Barcelona’s 2024 census data, I redistributed population onto a 100 × 100 m grid and compared those cells with café locations.
54% of cafés were located in higher-density areas.
That sounds like a strong relationship. But those same areas contained around 65% of Barcelona’s population.
So cafés were actually slightly underrepresented relative to the number of people living there.
In simple terms: The densest neighbourhoods do not automatically have the most cafés per person.
Population tells you where people live, but cafés respond to much more than residents: offices, visitors, retail streets, universities, public space and everyday movement all matter too. Density helps, but density alone is not the answer.
Land use: this is where the pattern became much clearer
This was the trickiest part of the analysis.
Barcelona’s land-use dataset was not neatly labelled as “residential”, “commercial” or “mixed use”.
Instead, it contained planning categories such as historic urban fabric, densification zones, infrastructure, green areas and different forms of residential development.
So rather than forcing everything into generic land-use labels, I grouped them into broader urban contexts.
That produced a much clearer result.
Around 83% of cafés were located in historic or dense/mixed urban fabric.
And this is where it gets interesting. Historic urban fabric represented only about 6% of the analysed grid, yet contained roughly 21% of all cafés.
Dense/mixed urban fabric represented about 28% of the grid, but contained roughly 62% of cafés. Together, those two types of urban fabric occupy around a third of the analysed city grid but contain more than four-fifths of the cafés.
Historic areas alone showed roughly 3.65× the café representation expected from their spatial share. That feels much closer to what you actually experience walking through Barcelona.
Cafés seem to thrive where the urban fabric is compact, established and layered with different kinds of activity.
Meanwhile, industrial land, infrastructure areas and large open spaces showed much weaker café presence.
About the method
The study combined OpenStreetMap café locations with:
tourist destinations, public-transport nodes, Barcelona’s pedestrian street network, 2024 census population data and official planning/land-use information.
Different spatial methods were used for each question distance analysis, accessibility surfaces, sampled network centrality, population grids and land-use representation ratios.
The results should be read as spatial associations, not proof of causation.