There’s a part of architectural workflow that hasn’t changed much in years
Revision checking :
Two drawings.
Side by side.
Zoom in, zoom out.
Try not to miss anything.
Even on projects that are fully modeled in BIM, this step often falls back to PDFs. And once you’re in PDF territory, you lose structure. Everything becomes visual again.
So the question is fairly simple:
Can we automate the first pass of revision checking?
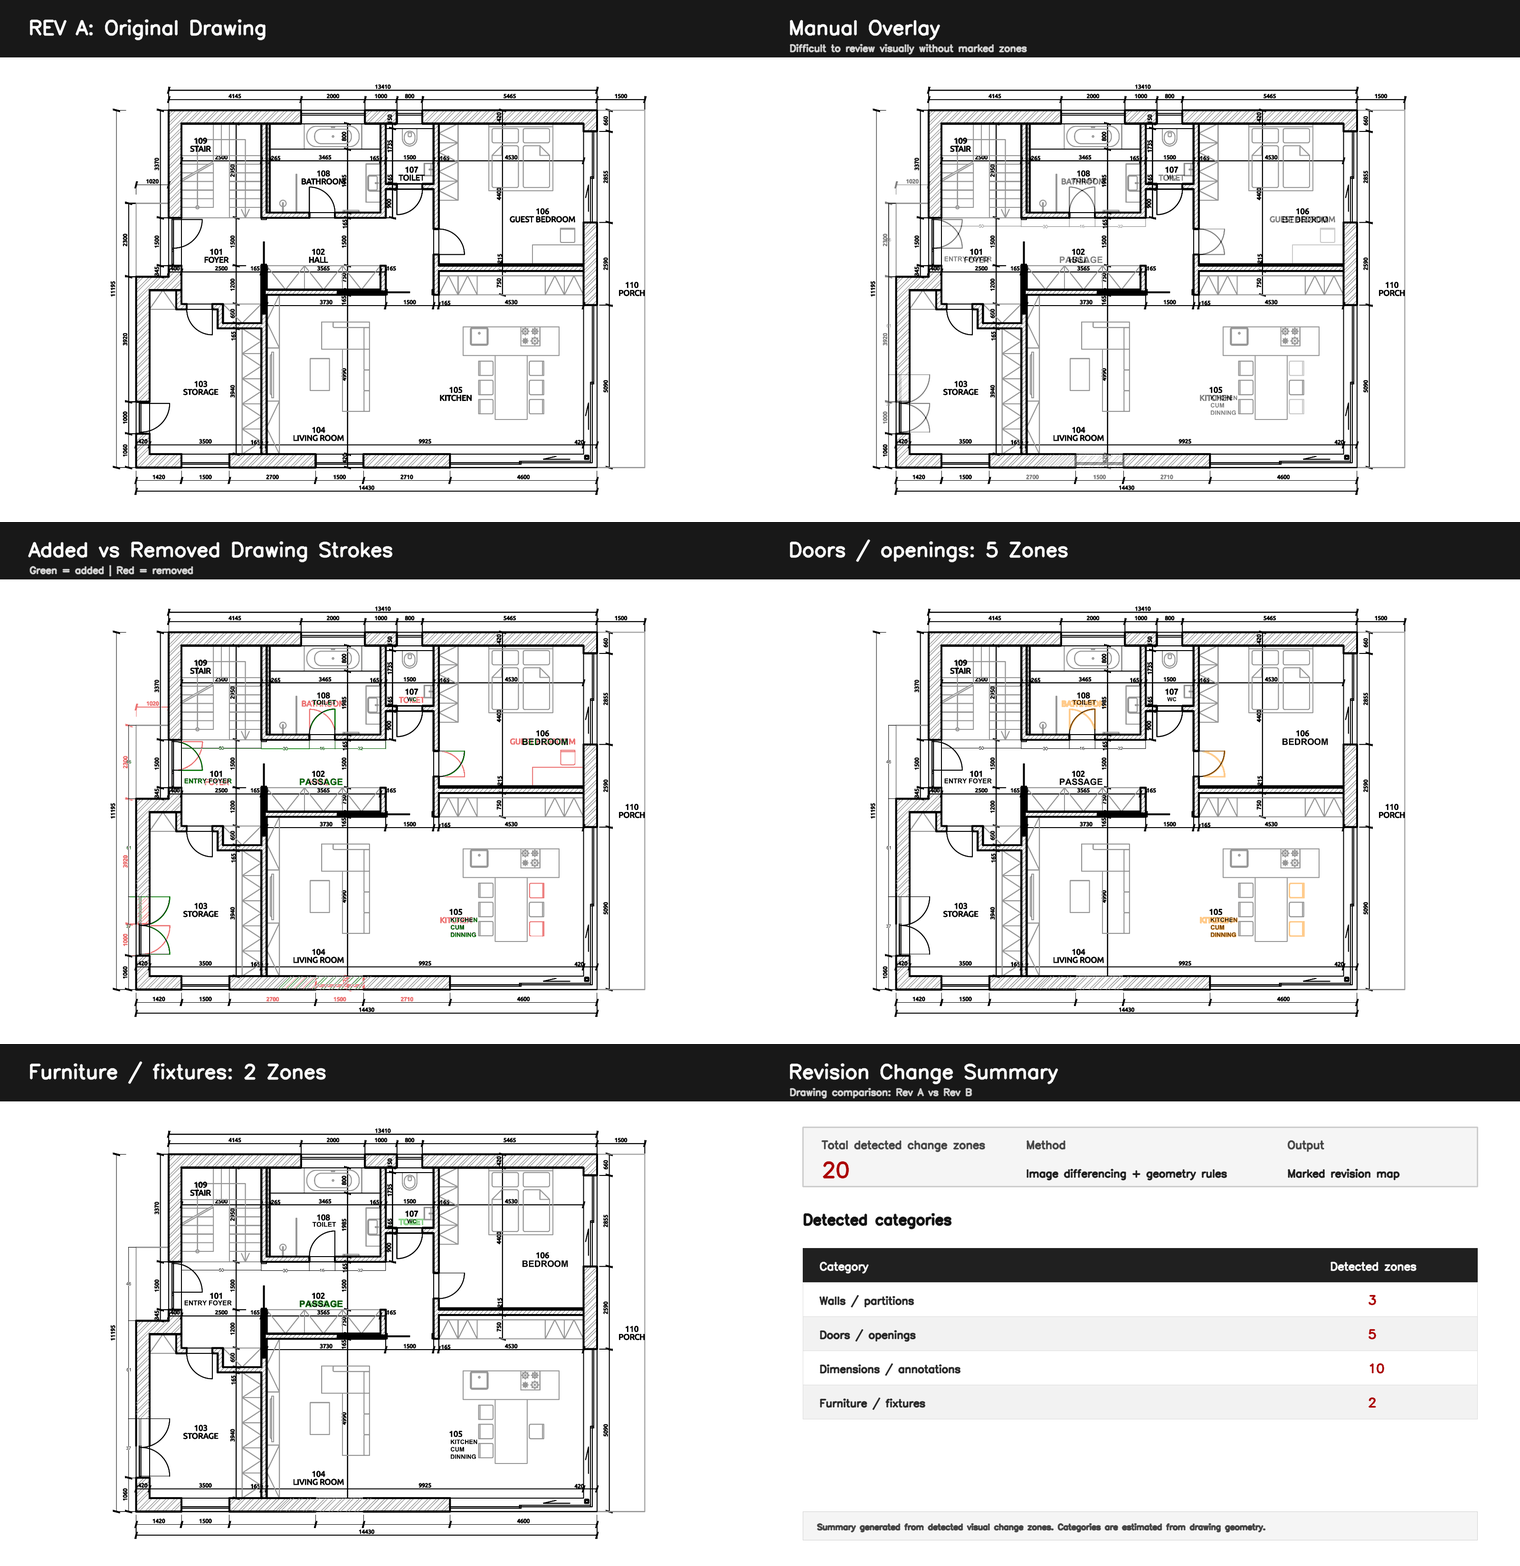
Comparison workflow highlighting spatial, geometric, and annotation-level changes between
two drawing versions using image-based differencing
© Naveen Maria Fleming / ArchitectsWhoCode
What was tested
The test was intentionally basic.
Two floor plan revisions:
- Rev A (original)
- Rev B (updated)
No CAD layers.
No BIM data.
Just flattened drawings.
The idea was to see how far a pure image-based approach could go.
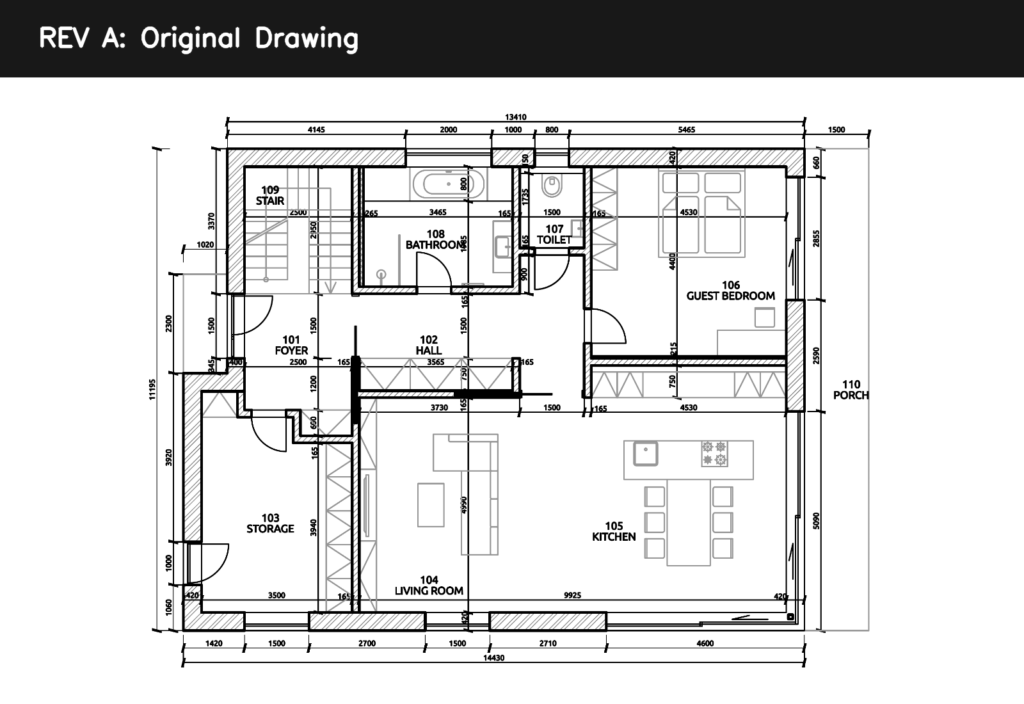
Reference drawing containing initial spatial layout, annotations, and architectural elements prior to modification
© Naveen Maria Fleming / ArchitectsWhoCode
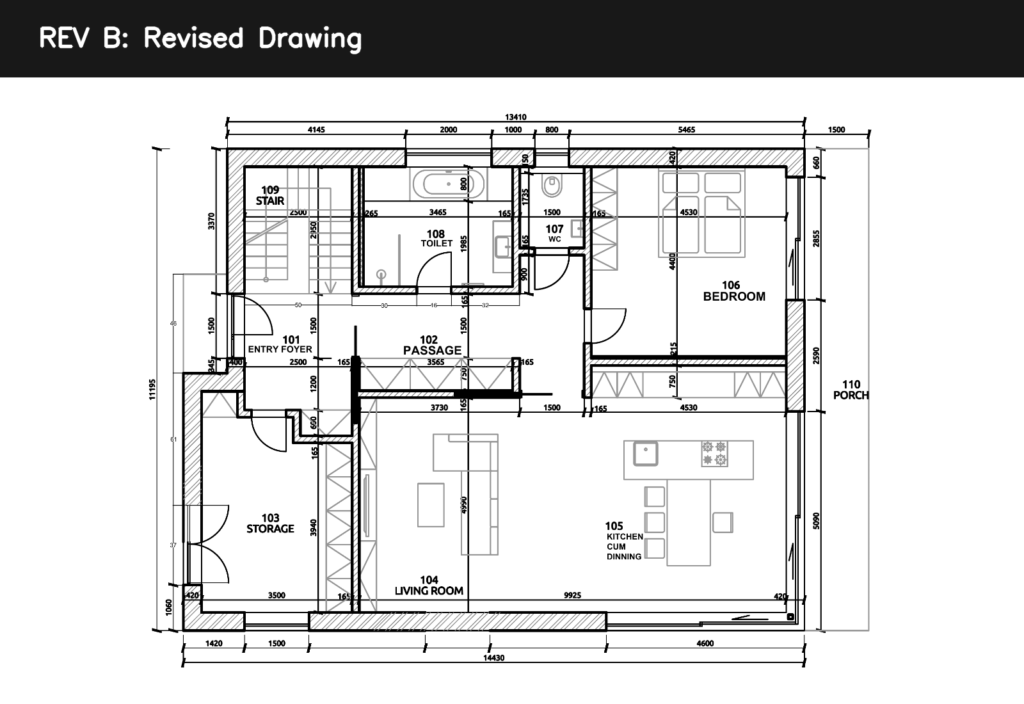
Updated drawing reflecting changes in layout, door configurations, dimensions, and text labels used for comparison against Revision A
© Naveen Maria Fleming / ArchitectsWhoCode
The workflow
The process is straightforward:
align both drawings
extract linework
compare pixel differences
group them into change zones
attempt classification
Nothing complex. Just enough to test the limits.
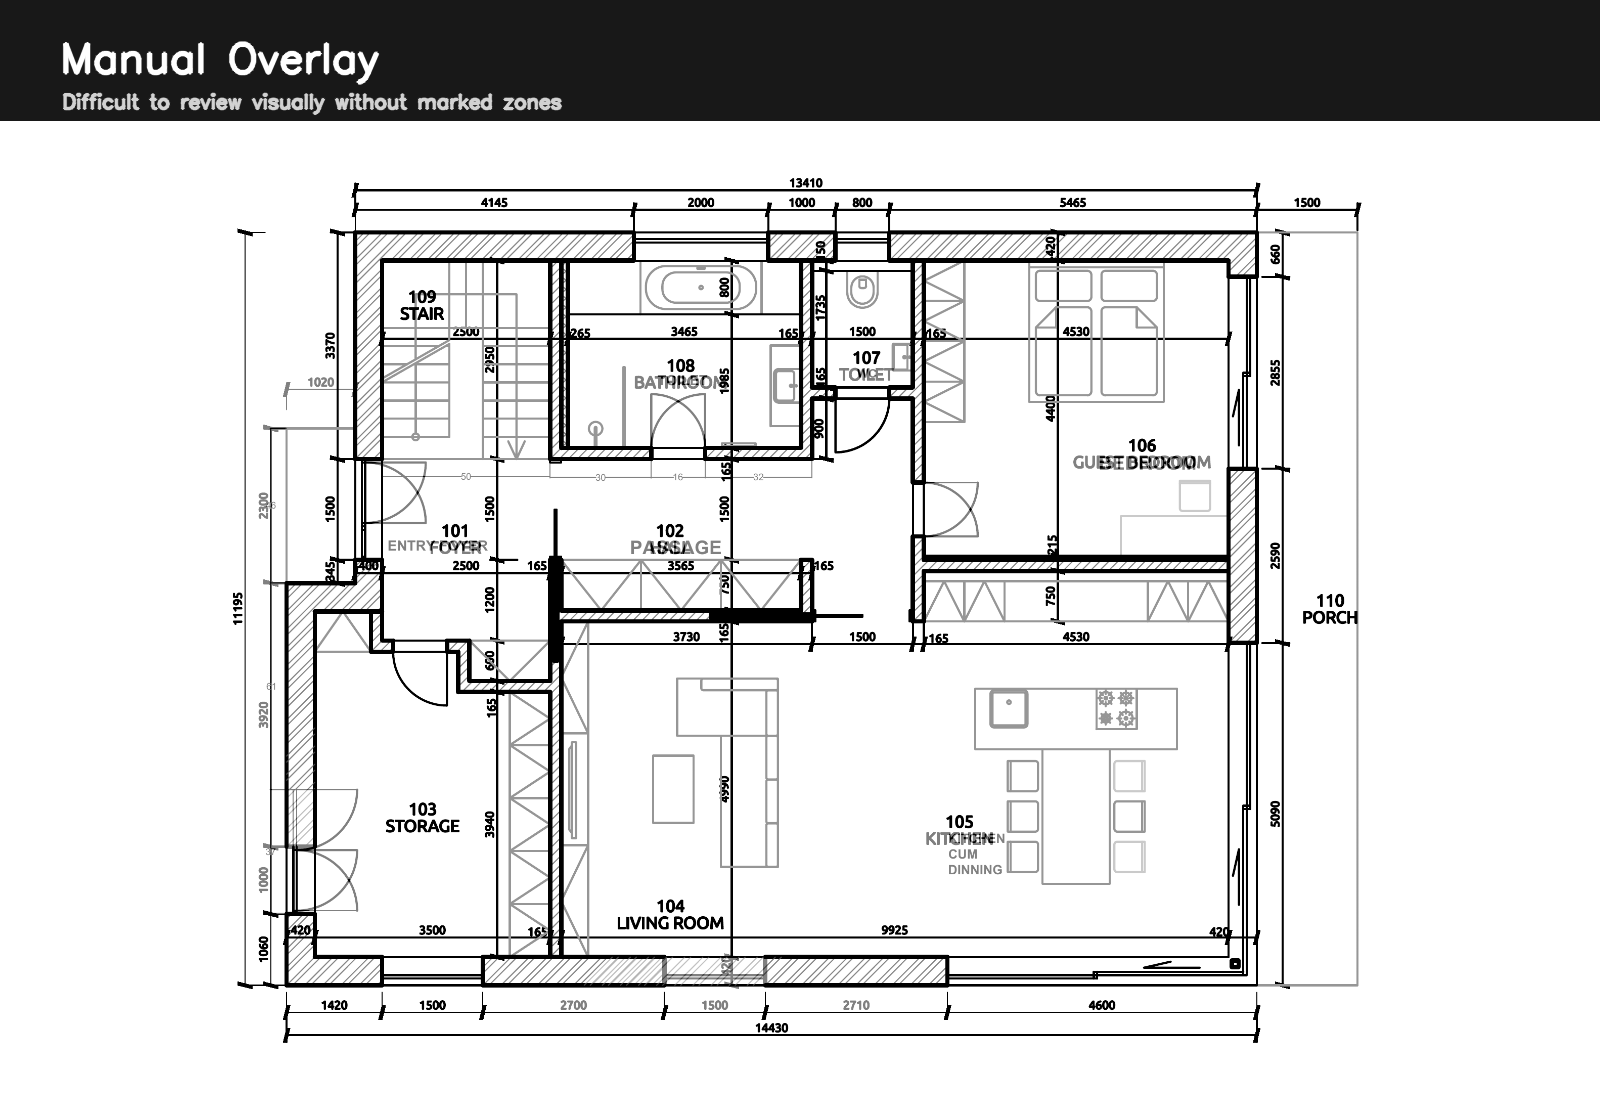
Direct visual overlay of both revisions without computational filtering, illustrating the difficulty of identifying changes through manual comparison alone
© Naveen Maria Fleming / ArchitectsWhoCode
What the system produces
The output is not a “checked drawing.”
It is a map of changes.
In this case:
→ around 20 detected zones
Each zone represents an area where something has changed.
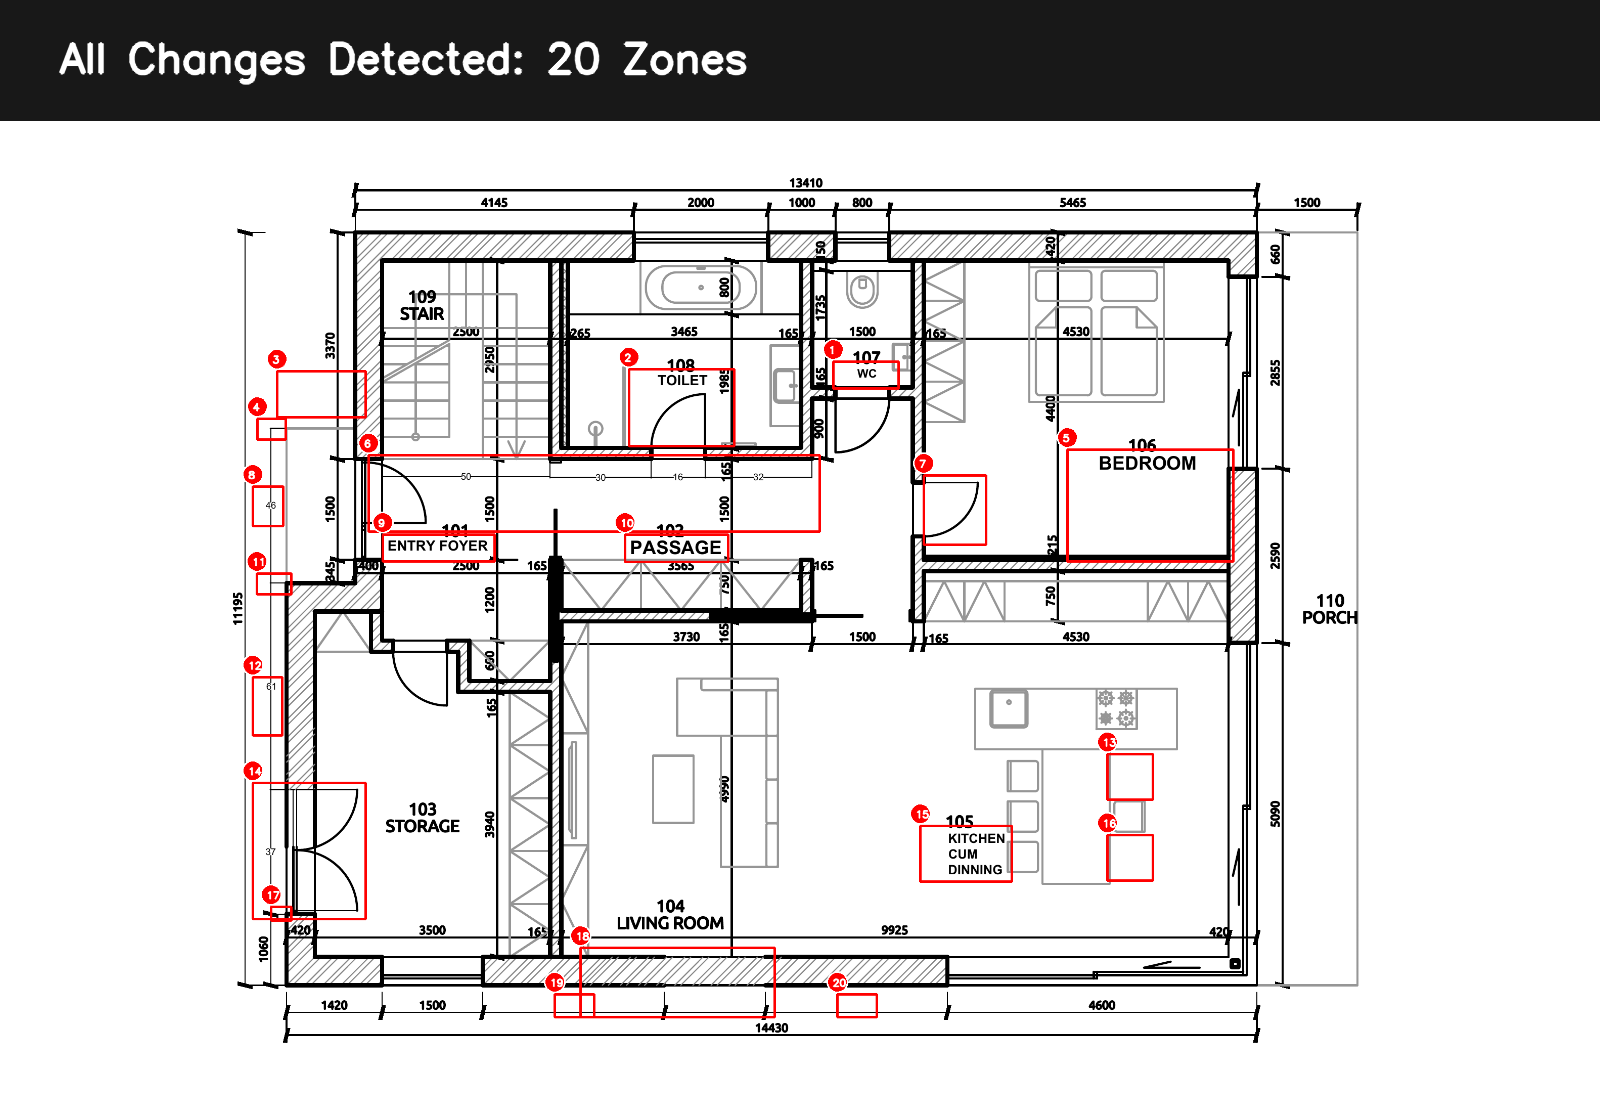
Detected Change Zones between Revision A and Revision B
Spatial clustering of visual differences using image differencing, highlighting 20 distinct change
regions requiring review. © Naveen Maria Fleming / ArchitectsWhoCode
On top of that, the system also shows:
added vs removed strokes
spatial clusters of changes
a combined overlay of all differences
This becomes a different way of reading a drawing.
Instead of scanning everything, you move between change zones.
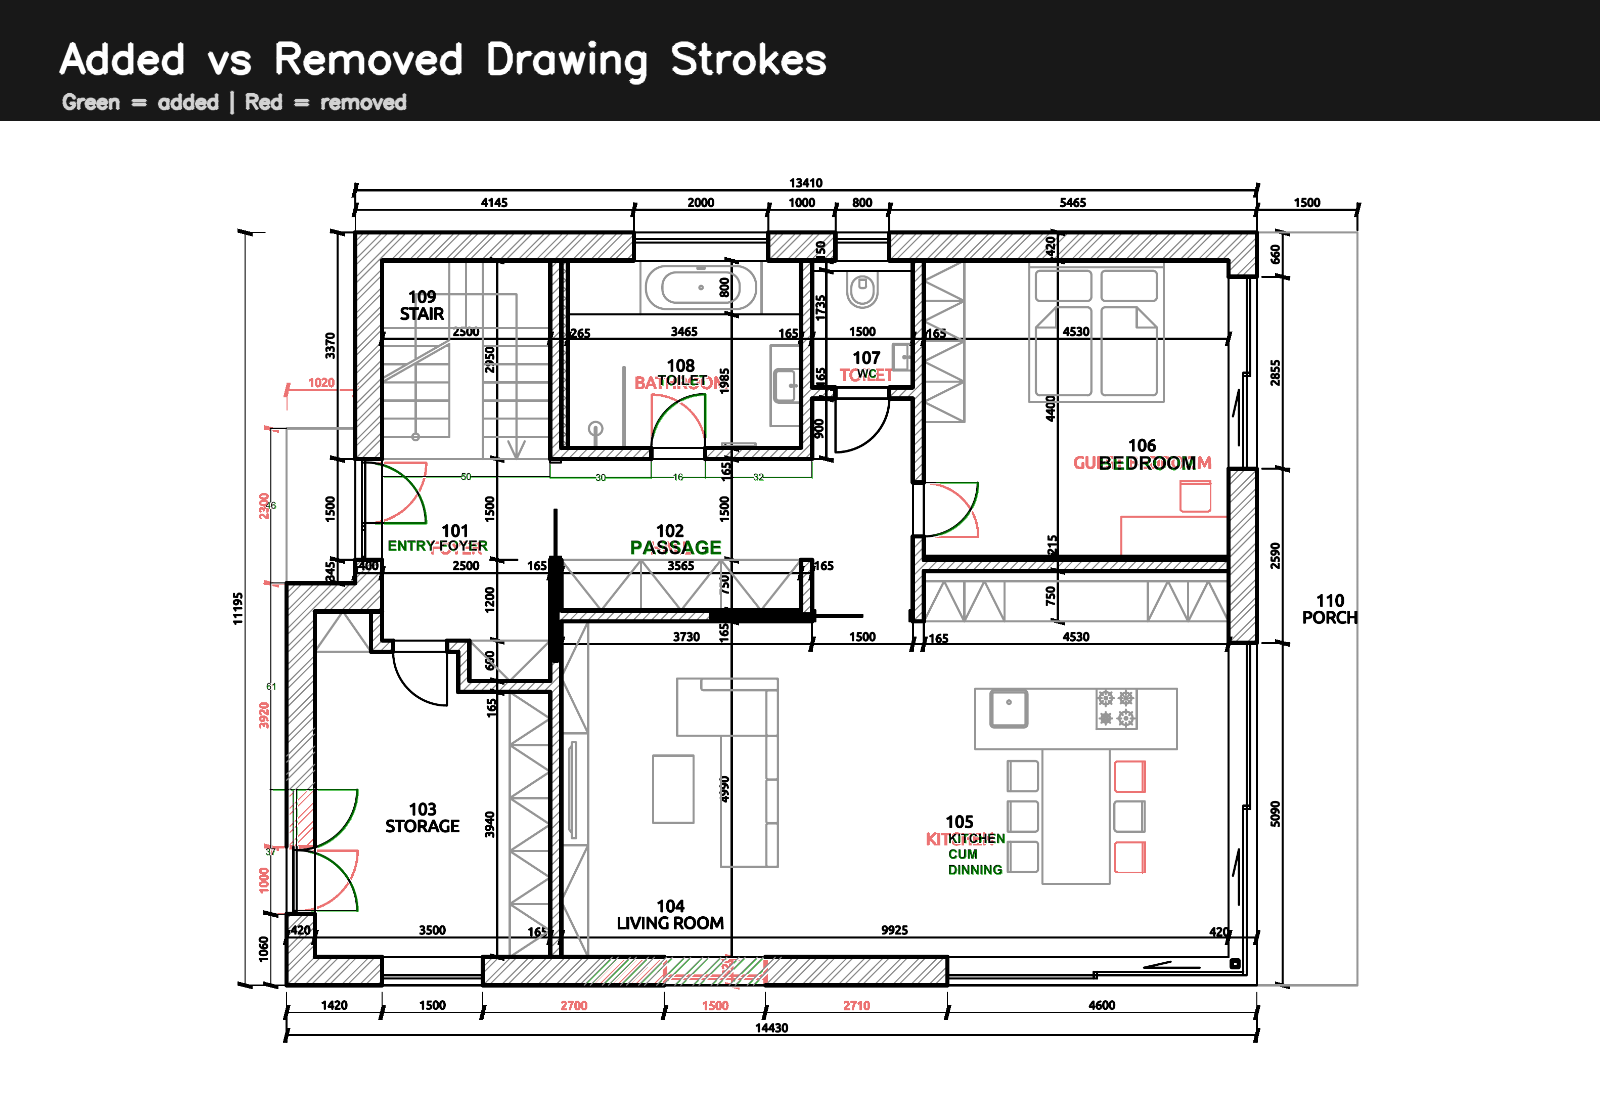
Added vs Removed Drawing Elements Identified through Pixel Differencing
Green indicates newly introduced elements in Revision B,
while red represents elements removed or modified from Revision A
© Naveen Maria Fleming / ArchitectsWhoCode
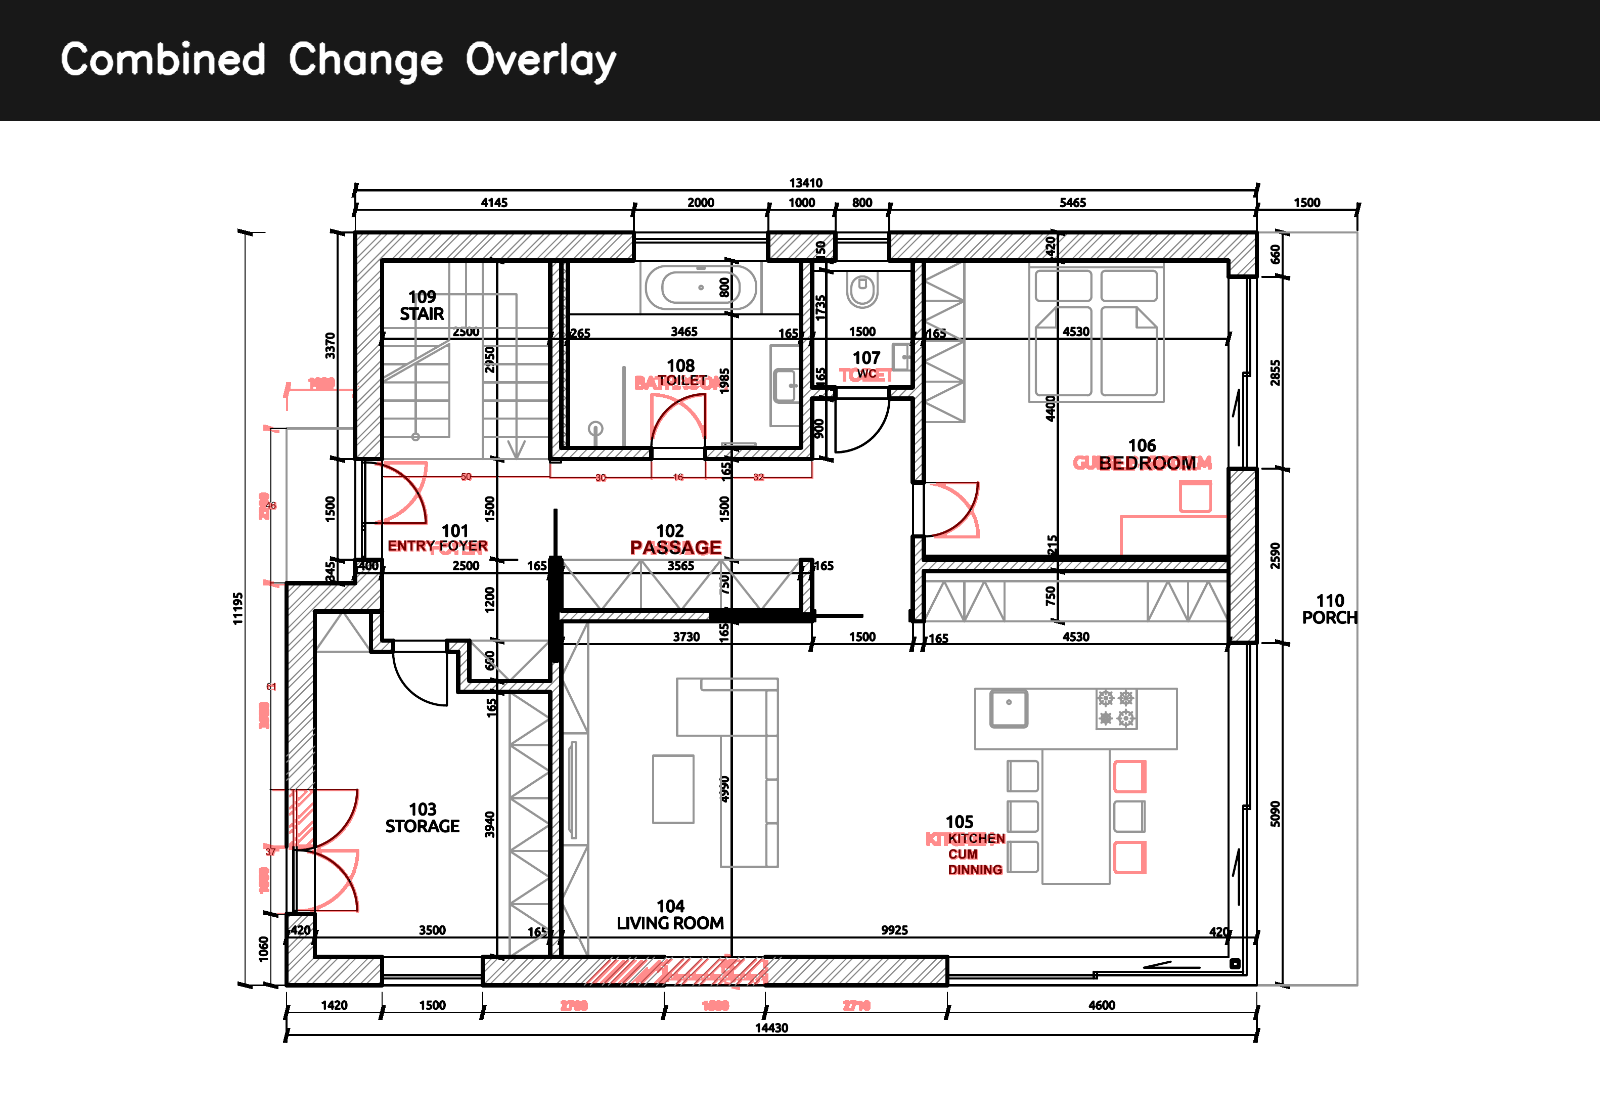
Combined Change Overlay across All Detected Categories
Unified visualization of all detected changes, integrating added, removed,
and categorized elements into a single review layer
© Naveen Maria Fleming / ArchitectsWhoCode
What works ?
The first result is actually useful.
The system can reliably tell you: “Something changed here.”
Not abstractly, but spatially:
clear clusters
visible boundaries
distinction between added and removed elements
Looking at the outputs:
door movements are captured
wall shifts are visible
text and annotation updates are picked up
even small graphical edits are detected
For coordination, this already reduces effort.
Instead of scanning the whole drawing, you jump directly to: 15–25 zones that actually need attention
That alone changes the workflow.
Where it starts to struggle
The moment you ask:
“What exactly changed?”
Things get messy.
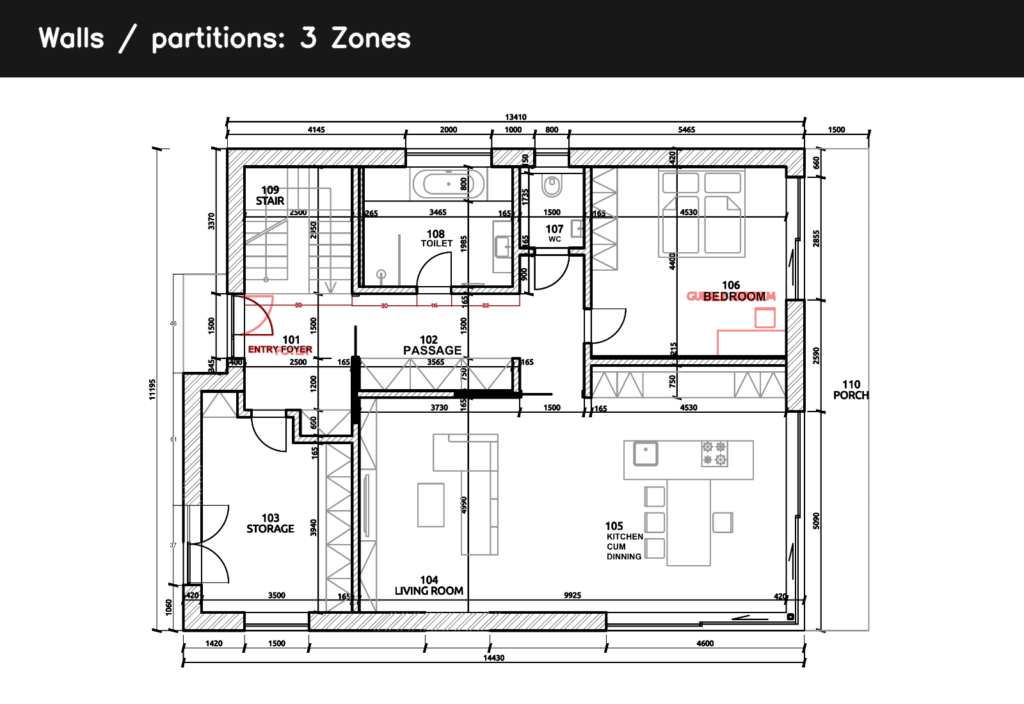
The system identifies linear change regions and classifies them as wall modifications; however, several detected zones correspond to door swings and interior elements, highlighting limitations of geometry-only classification
© Naveen Maria Fleming / ArchitectsWhoCode
A single zone could include:
a door shift
a wall segment
nearby text
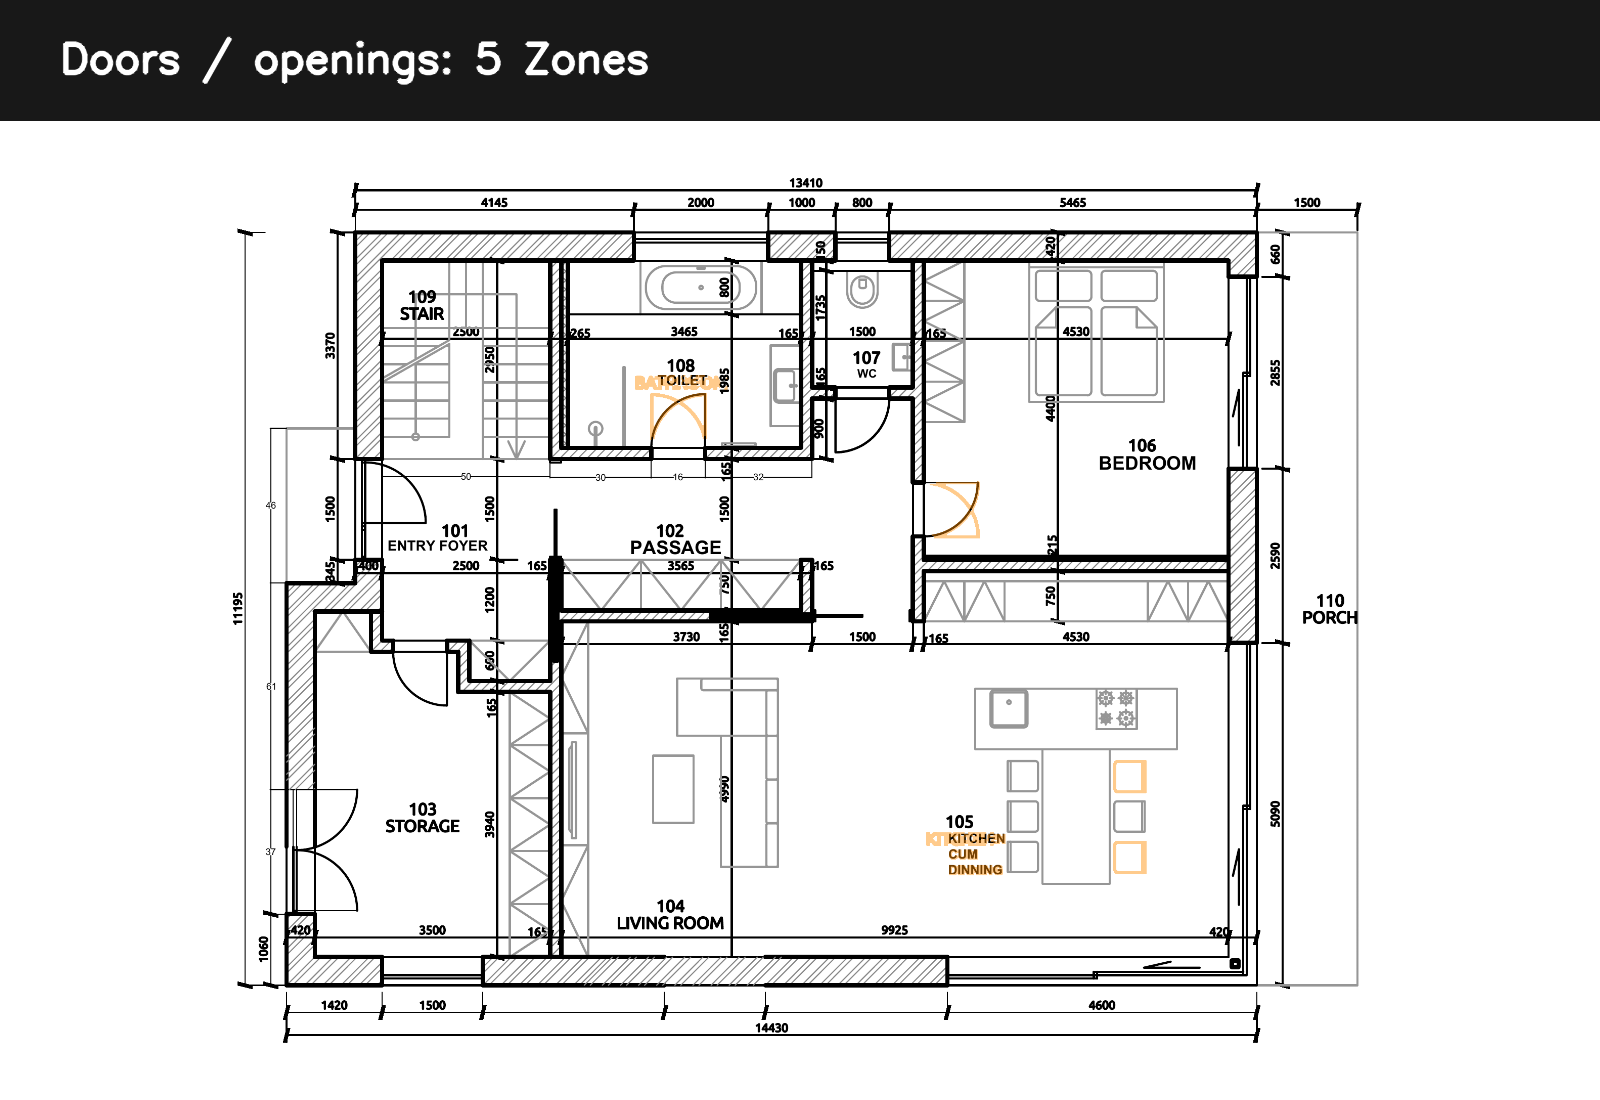
Curved and compact geometric changes are interpreted as door modifications, capturing swing adjustments and opening shifts, though some zones overlap with adjacent architectural elements
© Naveen Maria Fleming / ArchitectsWhoCode
From an image perspective, they overlap.
So classification becomes approximate.
Sometimes it works.
Sometimes it doesn’t.
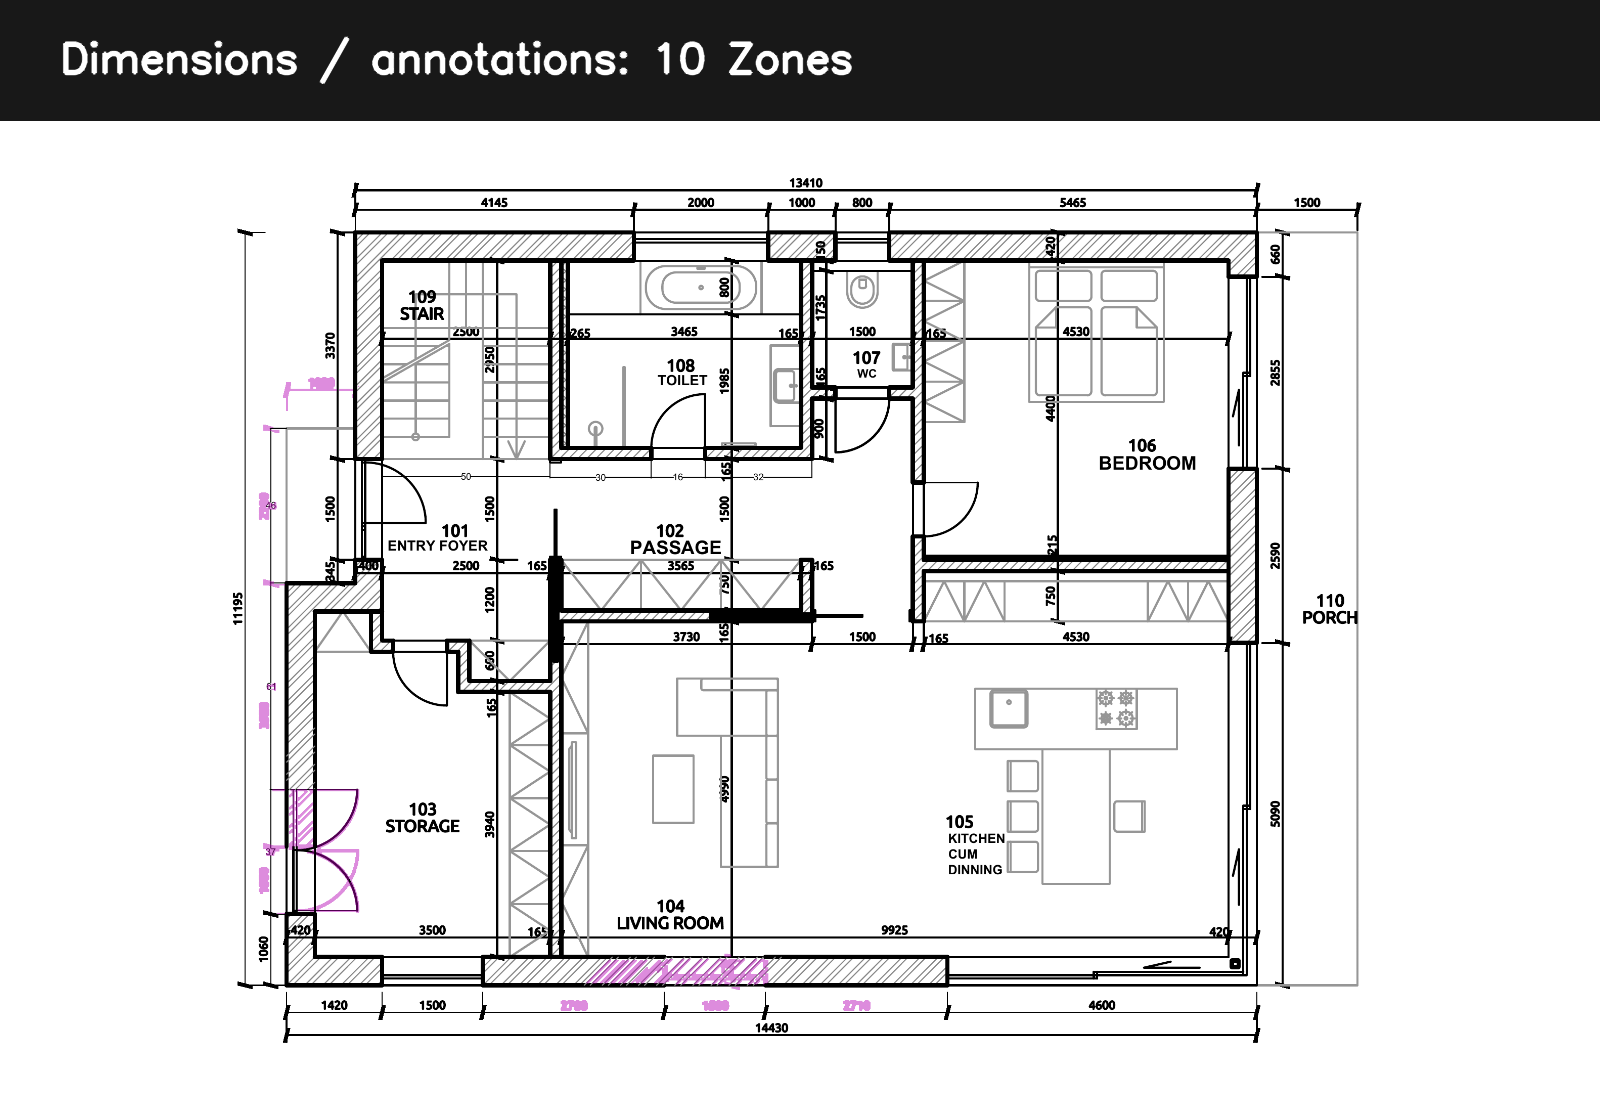
Linear and edge-aligned differences are classified as dimension updates, reflecting modifications in measurement lines and annotations, which dominate detection due to high visual contrast
© Naveen Maria Fleming / ArchitectsWhoCode
You start to see:
doors grouped with furniture
dimensions counted more than expected
small noise treated as real change
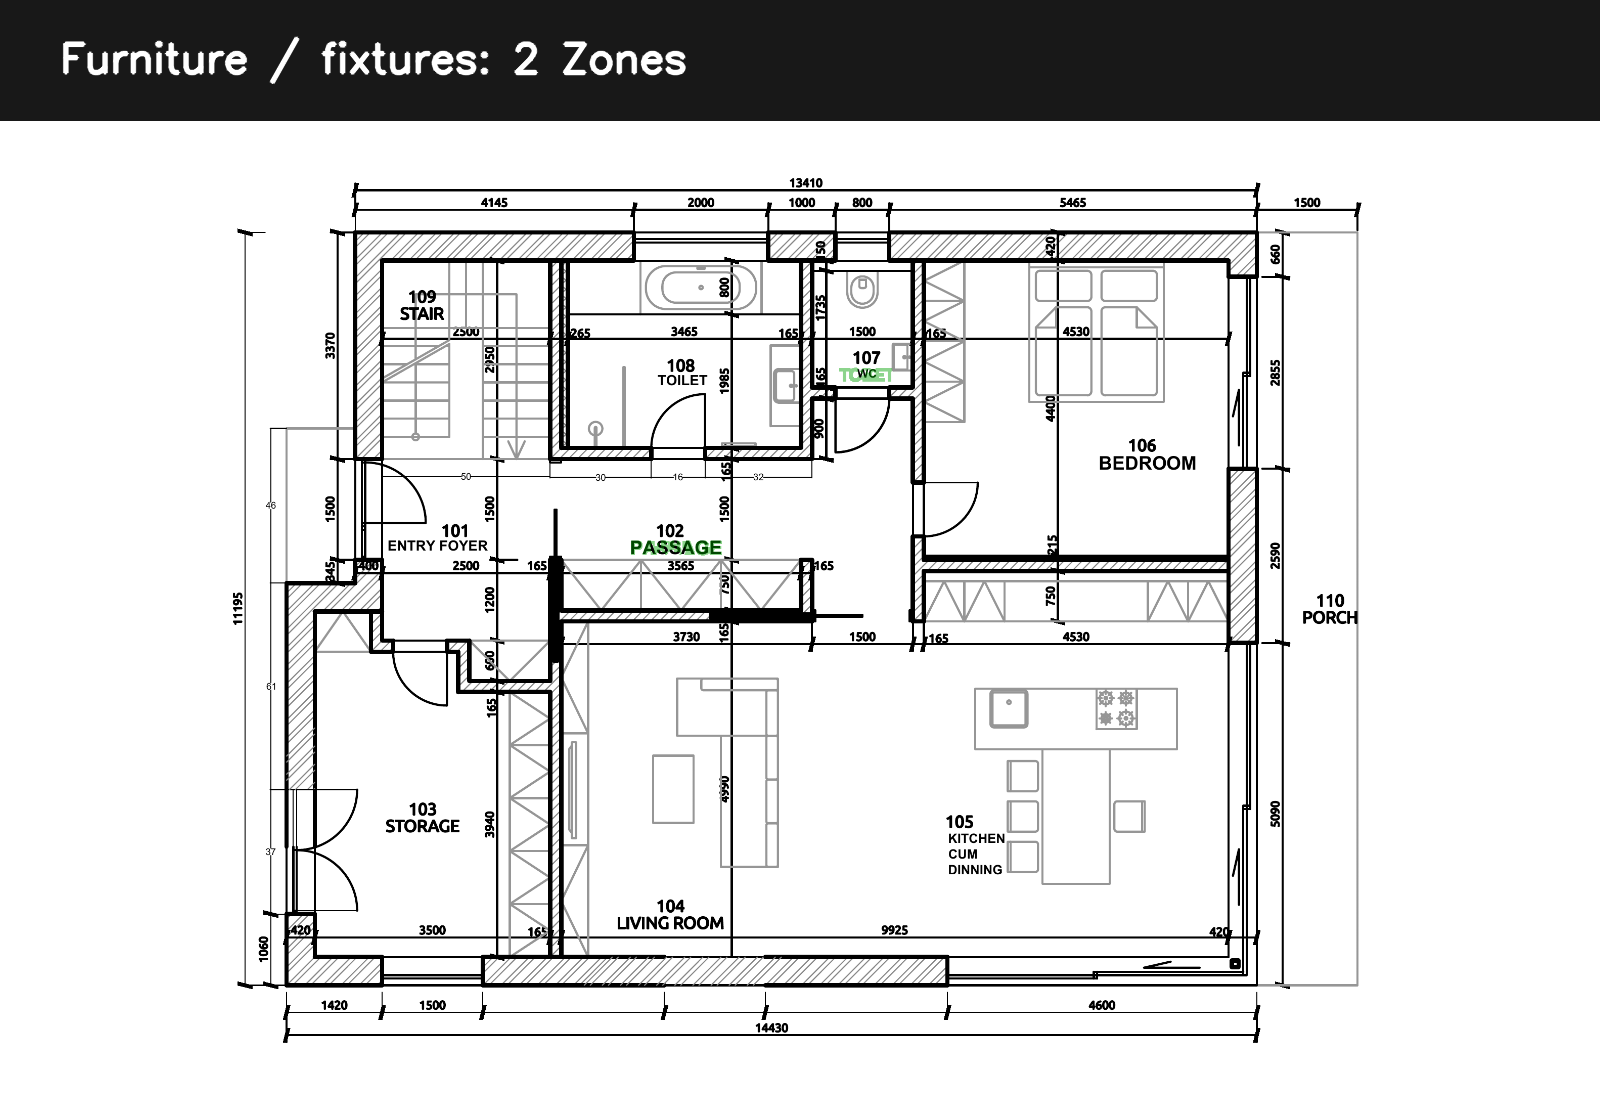
Small, localized changes within interior zones are classified as furniture updates; however, detection is misclassified
© Naveen Maria Fleming / ArchitectsWhoCode
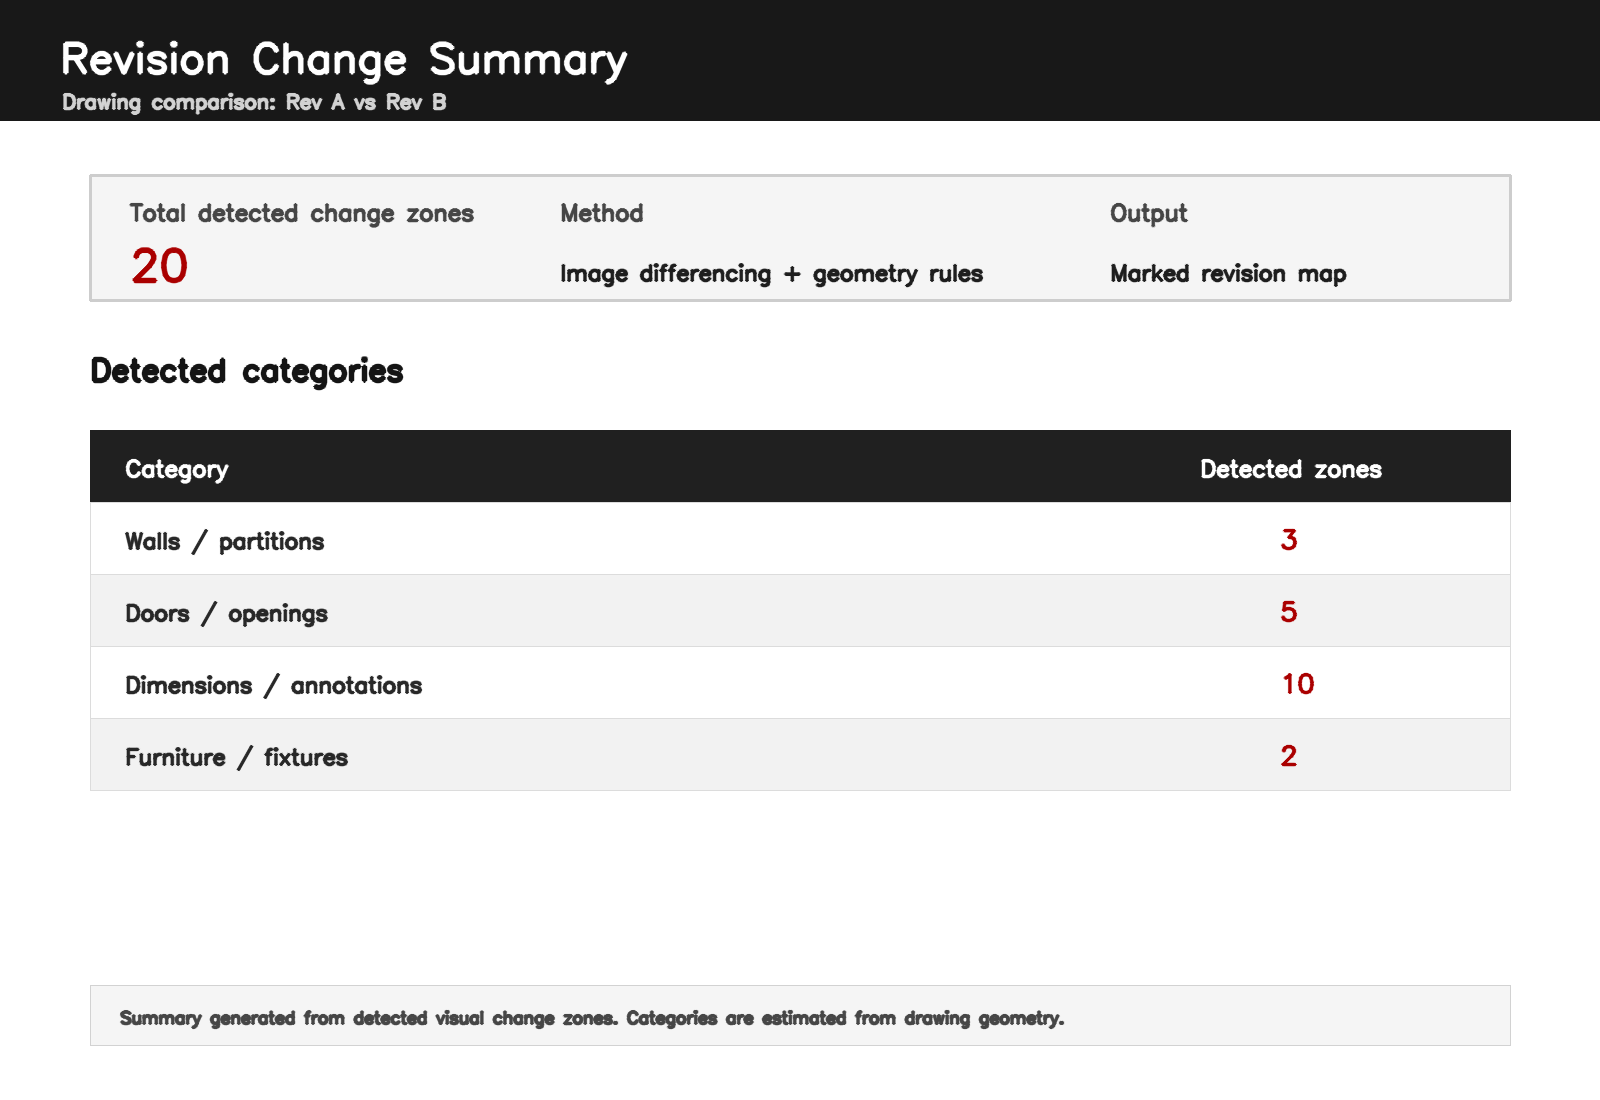
Total of 20 visually detected change regions classified into walls, doors, dimensions, and furniture based on geometric heuristics; category distribution reflects pattern-based grouping rather than true element-level understanding. © Naveen Maria Fleming / ArchitectsWhoCode
What this means in practice
This is not a “smart checker.”
It’s a visual filter.
And that distinction matters.
It won’t tell you:
- if a door type changed
- if a wall rating was updated
- if a dimension is correct
But it will tell you:
That shifts the workflow slightly:
- less time searching
- more time verifying
Where it needs to improve?
The main issue is not detection.
It is what happens after detection.
Right now, each zone is treated as a single unit. But in reality, a zone often contains multiple elements.
To improve this, three things become important:
First, zones need to be broken down further.
Instead of labeling a whole region, the system should look inside and separate different types of geometry.
Second, annotations need to be handled differently.
They are visually dominant and affect both detection and classification. Isolating them earlier would reduce noise.
Third, classification should be less rigid.
Not every zone needs a single label. Some changes are mixed, and the system should reflect that instead of forcing a category.
How this can be improved?
The next step is not making the system more “intelligent.”
It is making it more precise in how it reads each zone.
One way to do this is to break zones into smaller parts before assigning any category. Instead of labeling a full region, the system should look at the geometry inside it. A straight thick line behaves differently from a door arc. Text behaves differently from both. Even simple geometric separation can improve the result.
Another important step is handling annotations separately. Dimensions and text appear frequently and have strong visual contrast. Because of this, they dominate detection. If they are isolated early, the rest of the elements become easier to read and classify.
There is also a shift needed in how results are reported. Instead of forcing every zone into a single category, it is more useful to accept that some zones are mixed. A region can contain both a door and annotation change. Representing that clearly is more accurate than simplifying it.
A better revision checker does not need perfect classification.It needs consistent separation.
What this experiment shows?
From a technical standpoint, the system already solves an important part of the problem.
It can:
identify changes across drawings
locate them precisely
separate additions from removals
reduce the drawing to a finite set of review areas
This is not trivial. It removes the need to manually scan the entire sheet, which is where most of the time is spent.
What remains is a more contained problem: how to interpret each detected region in a way that aligns with how designers read drawings.
Final thought
This experiment shows that revision checking can be partially automated in a meaningful way.
Not by replacing the review process, but by restructuring it.
Instead of working across the entire drawing, the reviewer works across a defined set of change zones. That alone reduces cognitive load and improves consistency, especially in large drawing sets.
For this to become a reliable tool, the next step is not broader detection, but finer separation. The system needs to move from identifying “areas of change” to clearly describing what those changes consist of.
Once that layer is improved, the workflow becomes much stronger:
find changes quickly
review them systematically
focus attention where it actually matters
That is where this approach starts to become practical for everyday use in design and coordination.