Emergency preparedness in cities is often evaluated using fixed metrics such as response time, station distribution, and coverage radius. While these indicators are useful, they tend to simplify how emergency systems actually operate.
In reality, response is not static. It unfolds through movement shaped by road networks, connectivity, and local constraints. Understanding this dynamic behavior is essential to accurately assess how effectively a city can respond in critical situations.
© Naveen Maria Fleming / ArchitectsWhoCode
Understanding Response as Movement
This shift in perspective from static coverage to movement changes how we read the city. Instead of asking whether an area falls within a defined boundary, the focus moves to how quickly and effectively it can be reached.
By mapping response as it travels through the road network over time, coverage begins to appear as a gradual expansion rather than a fixed zone. This approach allows us to observe not just where response is available, but how it performs under real conditions.
What the Map Begins to Show
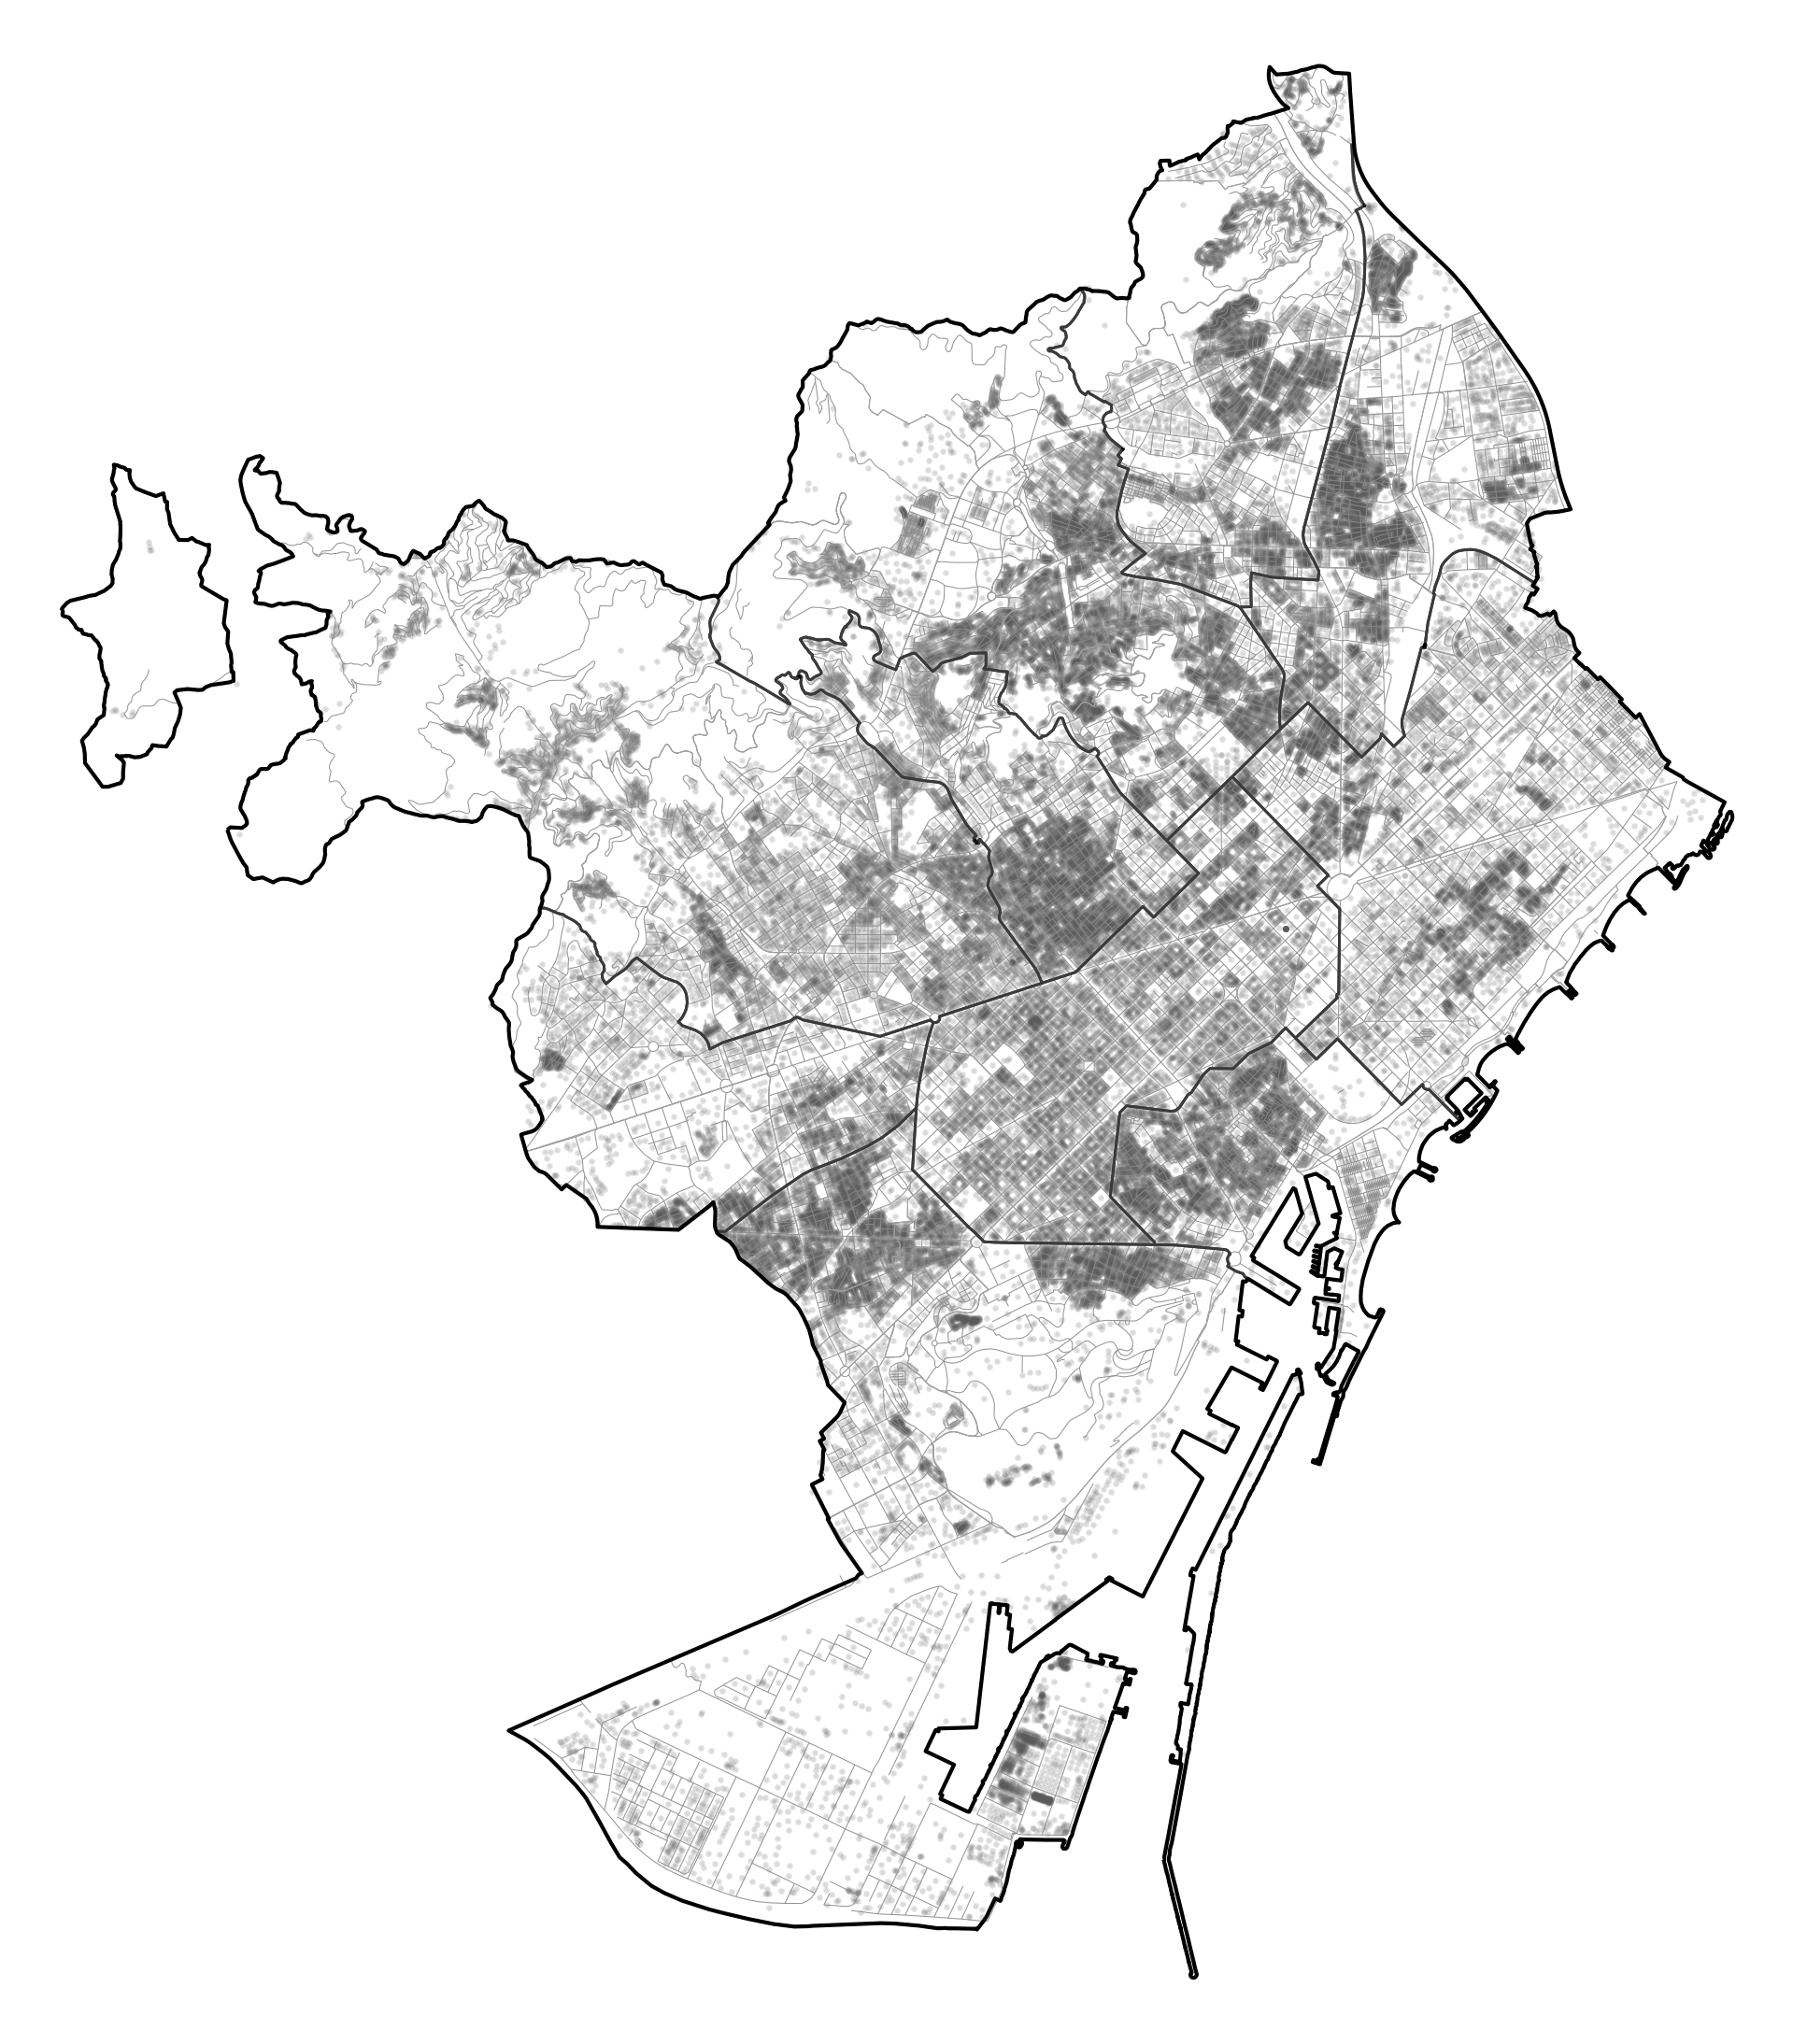
Once response is mapped over time, the city starts to reveal a different structure. In the initial minutes, the system appears efficient. Major routes extend reach quickly, and large portions of the city seem accessible.
However, as time progresses, differences become more visible. Some areas are reached almost immediately, supported by direct connections and dense networks. Others take longer not because they are far, but because the routes leading to them are less efficient.
There are also zones that only appear later in the timeline. These areas often remain unnoticed in conventional coverage maps, yet they highlight where the system begins to weaken. At this point, the map is no longer describing distance alone. It is reflecting accessibility under time pressure.
© Naveen Maria Fleming / ArchitectsWhoCode
Uneven Response Patterns
A key observation is that response does not spread evenly across the city. Even within similar distances from a station, response times can vary significantly. This creates a layered condition rather than a uniform one.
Some zones receive rapid and consistent access. Others experience noticeable delays. A few remain at the edge of effective reach, only covered after a longer duration.
This unevenness is important. It shows that preparedness is not only about whether coverage exists, but about how reliably and quickly it is delivered.
Understanding the Delays
What limits response is rarely just distance. More often, it is influenced by the structure of the urban network. how roads are connected, how dense the network is, and how easily different parts of the city link to each other.
Two locations at the same distance from a station can have very different response times depending on these factors. Barriers, indirect routes, and weak connections can slow movement significantly, even within areas that appear covered in static plans.
Mapping movement makes these constraints visible.
Why This Matters
Emergency preparedness is often assessed in terms of compliance whether certain thresholds are met or standards are satisfied.
However, real-world performance depends on how the system behaves over time.
By looking at response as a dynamic process, it becomes possible to:
- identify gaps before they lead to failure
- understand which areas are consistently underserved
- evaluate how resilient the system actually is
This shifts the focus from meeting requirements to understanding performance under real conditions.
Towards Better Planning
Reading response through movement opens up more precise ways to intervene.
Instead of only adding new infrastructure, it becomes possible to improve how the system functions by:
- strengthening weak connections
- improving accessibility in delayed zones
- prioritizing areas that consistently fall behind
In some cases, small changes in connectivity can significantly improve response times.
Conclusion
Cities are not static systems they operate through movement. To understand emergency preparedness effectively, it is necessary to move beyond fixed boundaries and examine how response actually travels through the urban network.
Because in an emergency, what matters is not just where help exists. but how quickly it can reach you.
References
Yin, J. et al. (2021). A city-scale assessment of emergency response accessibility and vulnerability under flooding conditions. Environment and Planning B.
Yao, J. et al. (2019). Location optimization of urban fire stations: Access and service coverage. Computers, Environment and Urban Systems.
Shahparvari, S. et al. (2020). Spatial accessibility of fire stations for enhancing operational response and reducing risk. Fire Safety Journal.
Esri. Service area analysis. GIS Dictionary.
ESRI. ArcGIS Network Analyst: Routing, Closest Facility, and Service Area Analysis.
Zhou, T. et al. (2024). Hierarchical dynamic estimation of fire service accessibility based on real-time traffic.