There’s something slightly incomplete about the way we usually read architectural drawings.
Plans tell us where things are walls, rooms, doors etc. They describe structure very clearly. But they don’t really show how movement unfolds inside that structure.
Most of the time, we rely on intuition for that. You look at a plan and you sense how people might move through it. You imagine circulation, you anticipate congestion, you assume certain paths will be used more than others.
But What if movement could be read directly from the plan itself?
© Naveen Maria Fleming / ArchitectsWhoCode
© Naveen Maria Fleming / ArchitectsWhoCode
From Plan to System
The intention was not to simulate people or make claims about real human behavior. That would be misleading. Movement in reality is shaped by factors such as intention, perception, and context none of which are contained within a drawing. Instead, the focus remained on the plan itself.
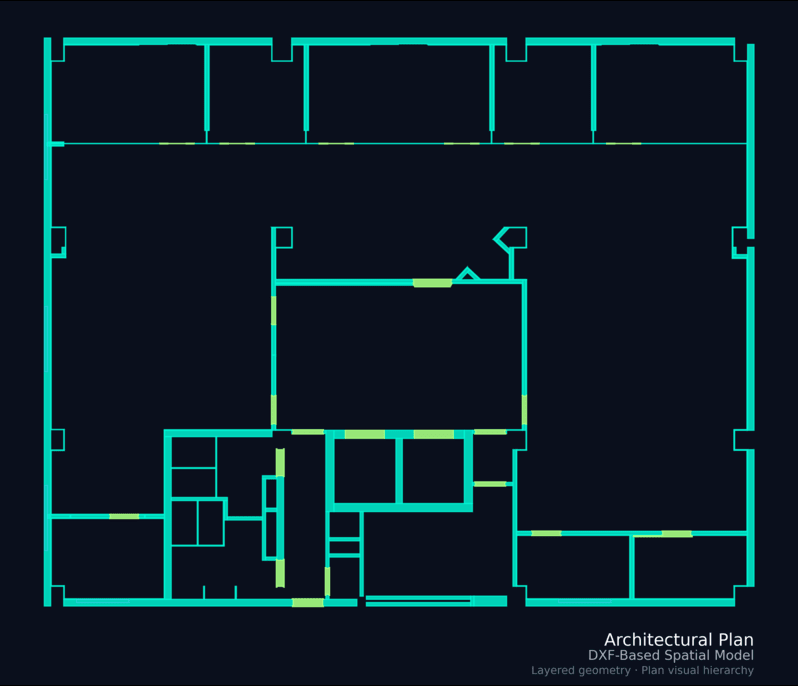
When reduced to its underlying structure, a plan can be understood as a set of spaces connected through defined relationships. Rooms are linked by doors, and movement is implicitly suggested through these connections, even if it is not explicitly represented.
To make this structure legible, the plan was translated into a simplified system.
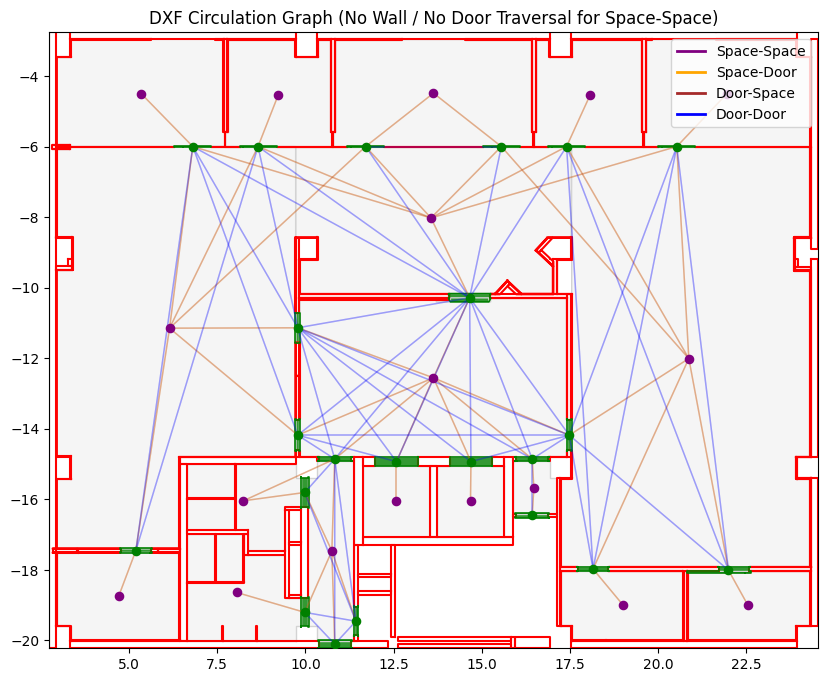
Spaces were treated as points, and doors as connections between them. This abstraction was intentionally minimal, retaining only what was necessary to describe how spaces relate to one another.
With this shift, the drawing begins to read differently. It no longer operates purely as a static composition of elements, but as a system of relationships that can be followed and evaluated.
Within this system, movement does not need to be assumed. It can be traced directly through the connections that already exist within the plan.
© Naveen Maria Fleming / ArchitectsWhoCode
© Naveen Maria Fleming / ArchitectsWhoCode
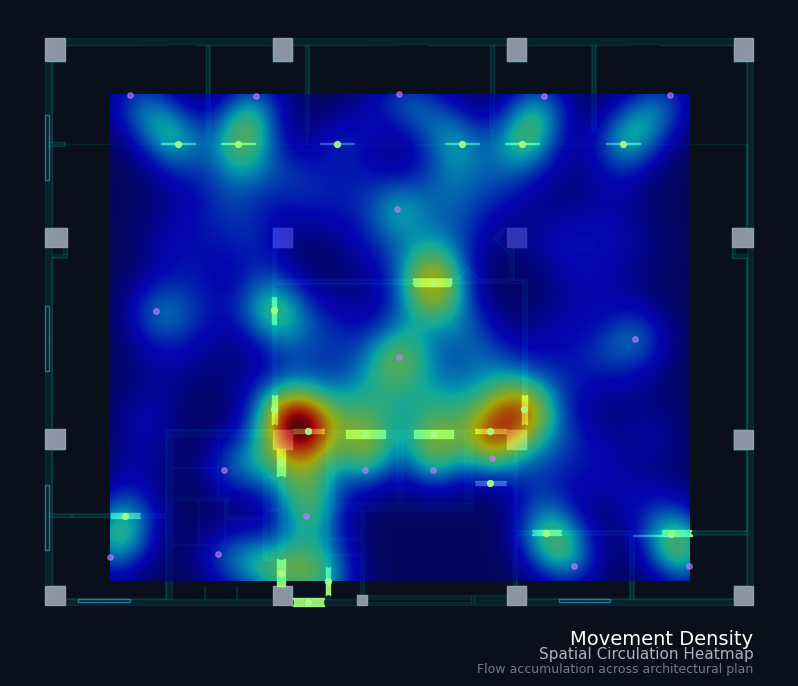
From Paths to Patterns
Once the plan is set up this way, you can start tracing paths between spaces. These aren’t meant to represent how people actually move. They’re just the most direct connections the layout allows.
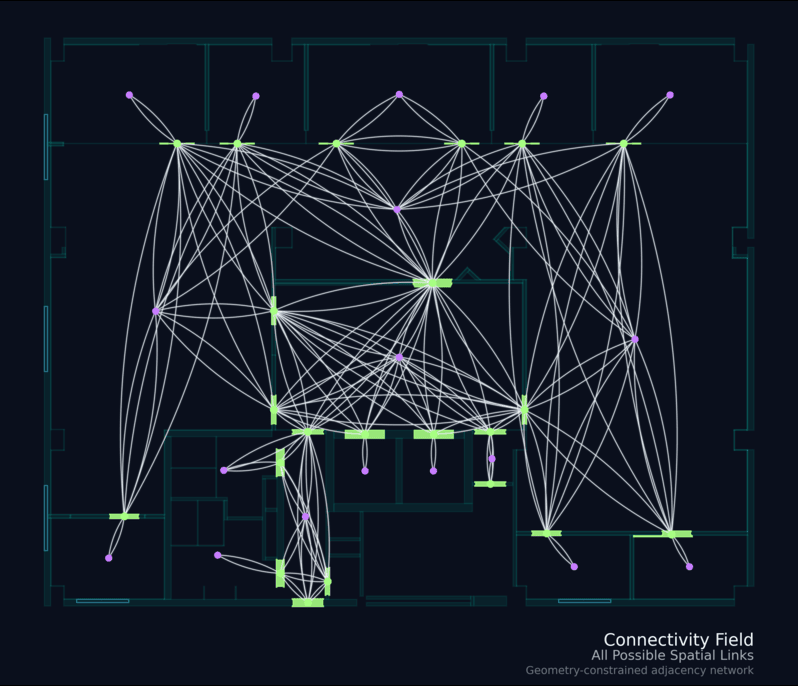
But when you look at all of them together, something starts to happen. Some routes keep showing up again and again. Others barely appear.
And after a point, you stop seeing individual paths. You start noticing where movement is concentrating. Certain parts of the plan begin to behave like corridors, even if they weren’t designed as such. Other areas stay relatively quiet.
Nothing new is being added here.
This is already part of the plan, it just becomes easier to see once everything is mapped out this way.
© Naveen Maria Fleming / ArchitectsWhoCode
© Naveen Maria Fleming / ArchitectsWhoCode
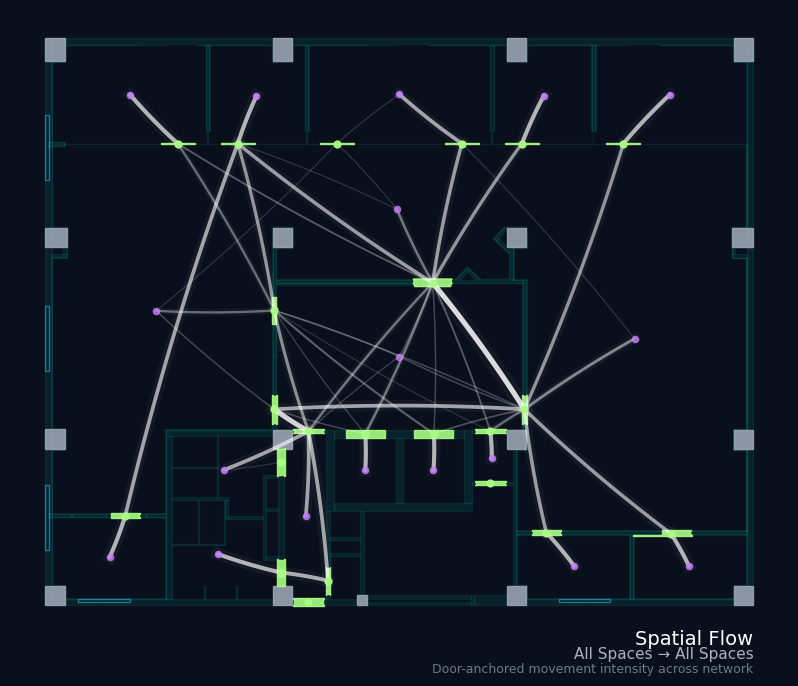
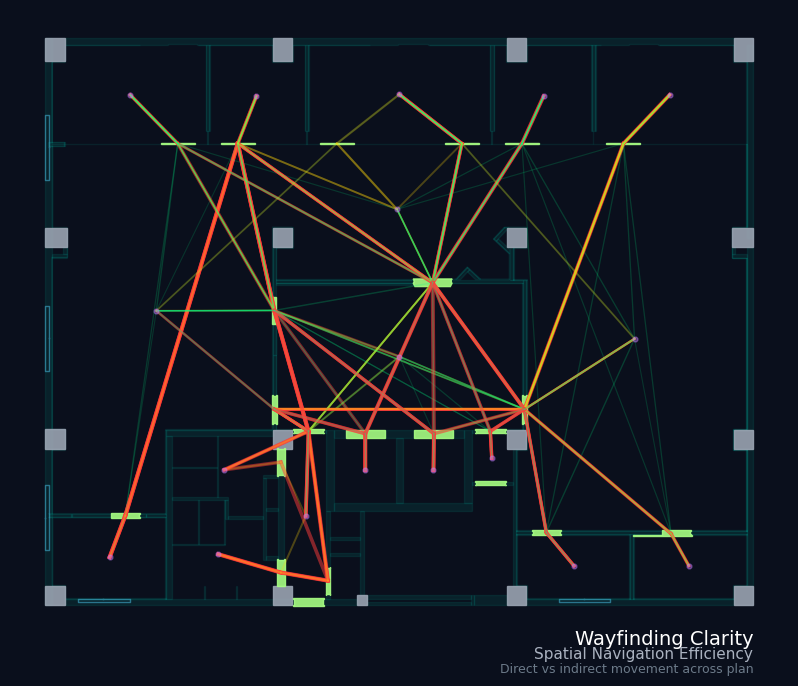
Spatial Flow
When you look at all the paths together, some parts of the plan start to carry more movement than others.
It’s not something you notice immediately in the drawing, but once it’s mapped, it becomes quite clear. A few areas begin to take most of the flow, while others stay relatively unused.
Nothing new is being introduced here. This is already part of the layout. It just becomes visible when everything is considered together.
© Naveen Maria Fleming / ArchitectsWhoCode
© Naveen Maria Fleming / ArchitectsWhoCode
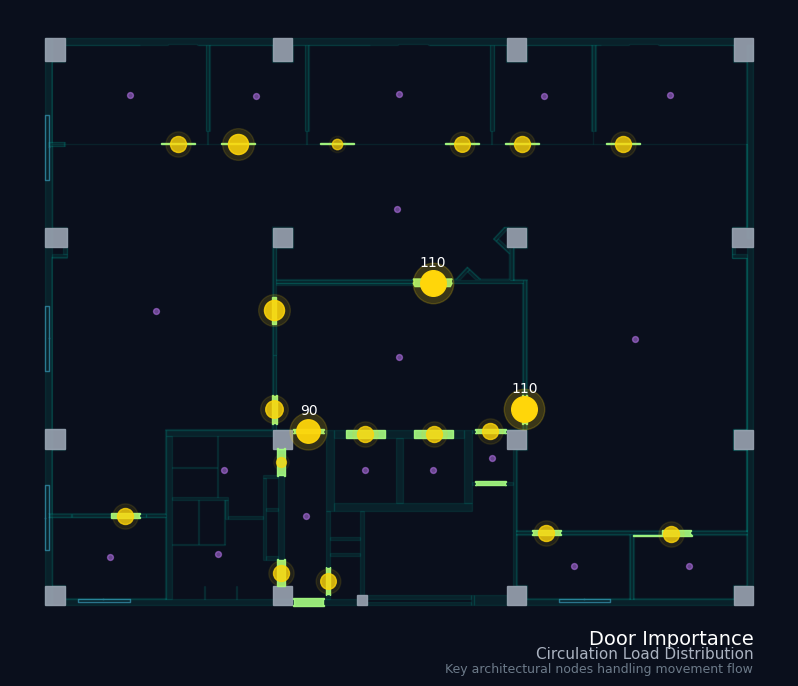
What it shows?
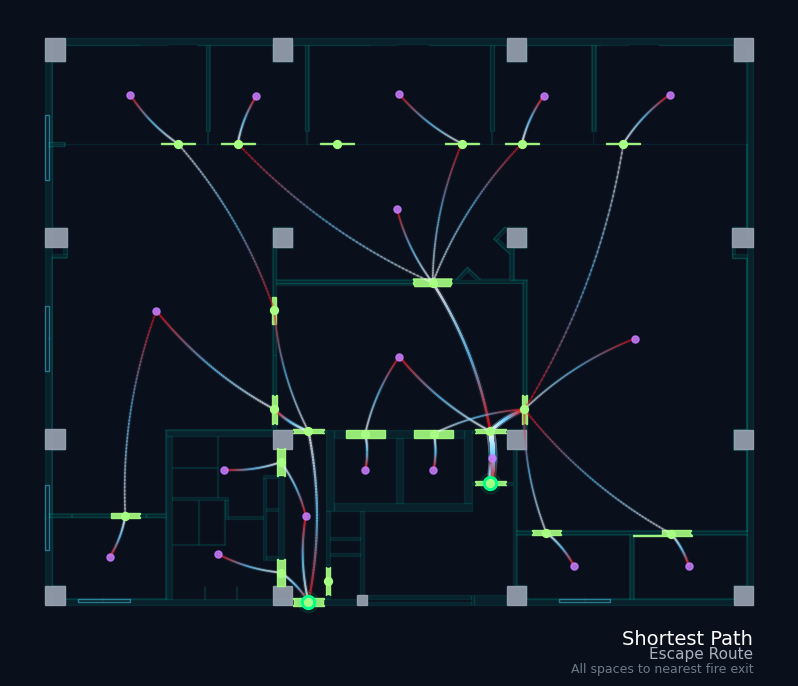
Movement rarely distributes evenly across a plan. It tends to concentrate through a smaller set of connections.
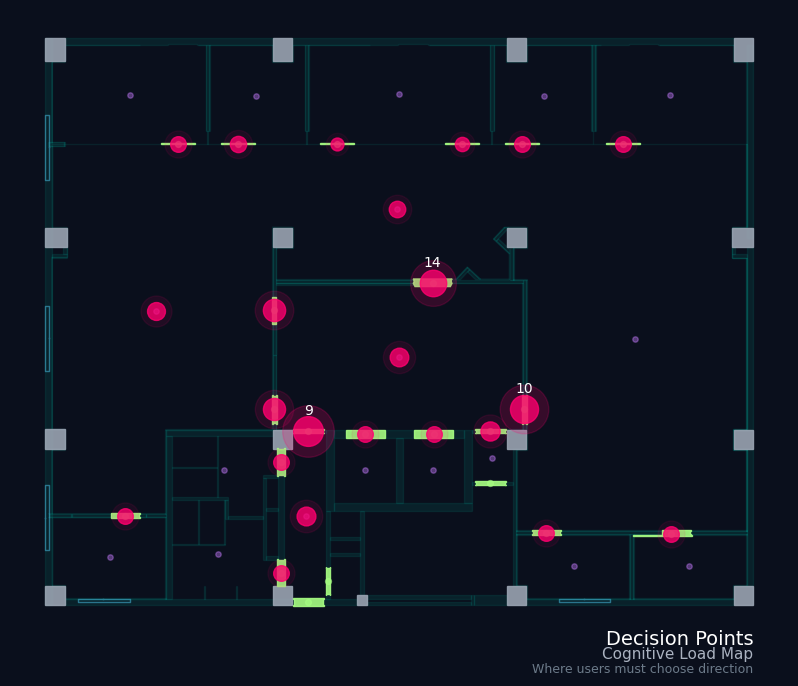
Some doors begin to carry more flow than others, almost acting as key transitions within the layout. Certain points introduce choice, while others allow movement to pass through without interruption.
These differences are not always obvious when reading a plan directly. But once the structure is mapped in this way, they become much easier to recognise.
© Naveen Maria Fleming / ArchitectsWhoCode
Limitations
This approach doesn’t describe how people actually move through a building.
In reality, movement is shaped by many factors that don’t exist in a plan. where someone is trying to go, what they can see, how familiar they are with the space, even how they feel in it. None of that is captured here.
What this model does instead is isolate the structure of the layout. It looks only at how spaces are connected, and what those connections make possible in terms of movement.
Because of that, the results shouldn’t be read as a prediction of behavior. They are closer to a baseline, a way of understanding what the plan allows before anything human is added on top of it.
That distinction is important. It means the analysis won’t tell you exactly how people will move, but it can still show where movement is likely to be easy, where it becomes indirect, and where the layout starts to introduce complexity.
Conclusion
Plans are usually read for how space is arranged. Where things sit, how rooms connect, how circulation might work.
Looking at them through movement shifts that a bit. You start noticing how those connections actually behave. Some paths stay direct. Others stretch out or depend on a few key points to work. None of this is new information. It is already in the plan. It just does not stand out when you read it in the usual way.
This way of looking at it does not replace anything. It just adds another layer. One that makes it easier to understand how movement is set up within the space.