Introduction
Cities are often described as engines of opportunity, places where access to education, healthcare, mobility, and culture is concentrated. But this promise is not experienced equally by everyone.
Behind the visible order of streets and buildings lies a quieter question: who has access, and who does not?
Urban justice is not only about what exists in a city, but how it is distributed. While inequality is often discussed in economic or social terms, its spatial dimension is equally critical. The city itself its layout, infrastructure, and services can reinforce or reduce inequality.
This raises an important question: can spatial data help us understand urban justice more clearly?
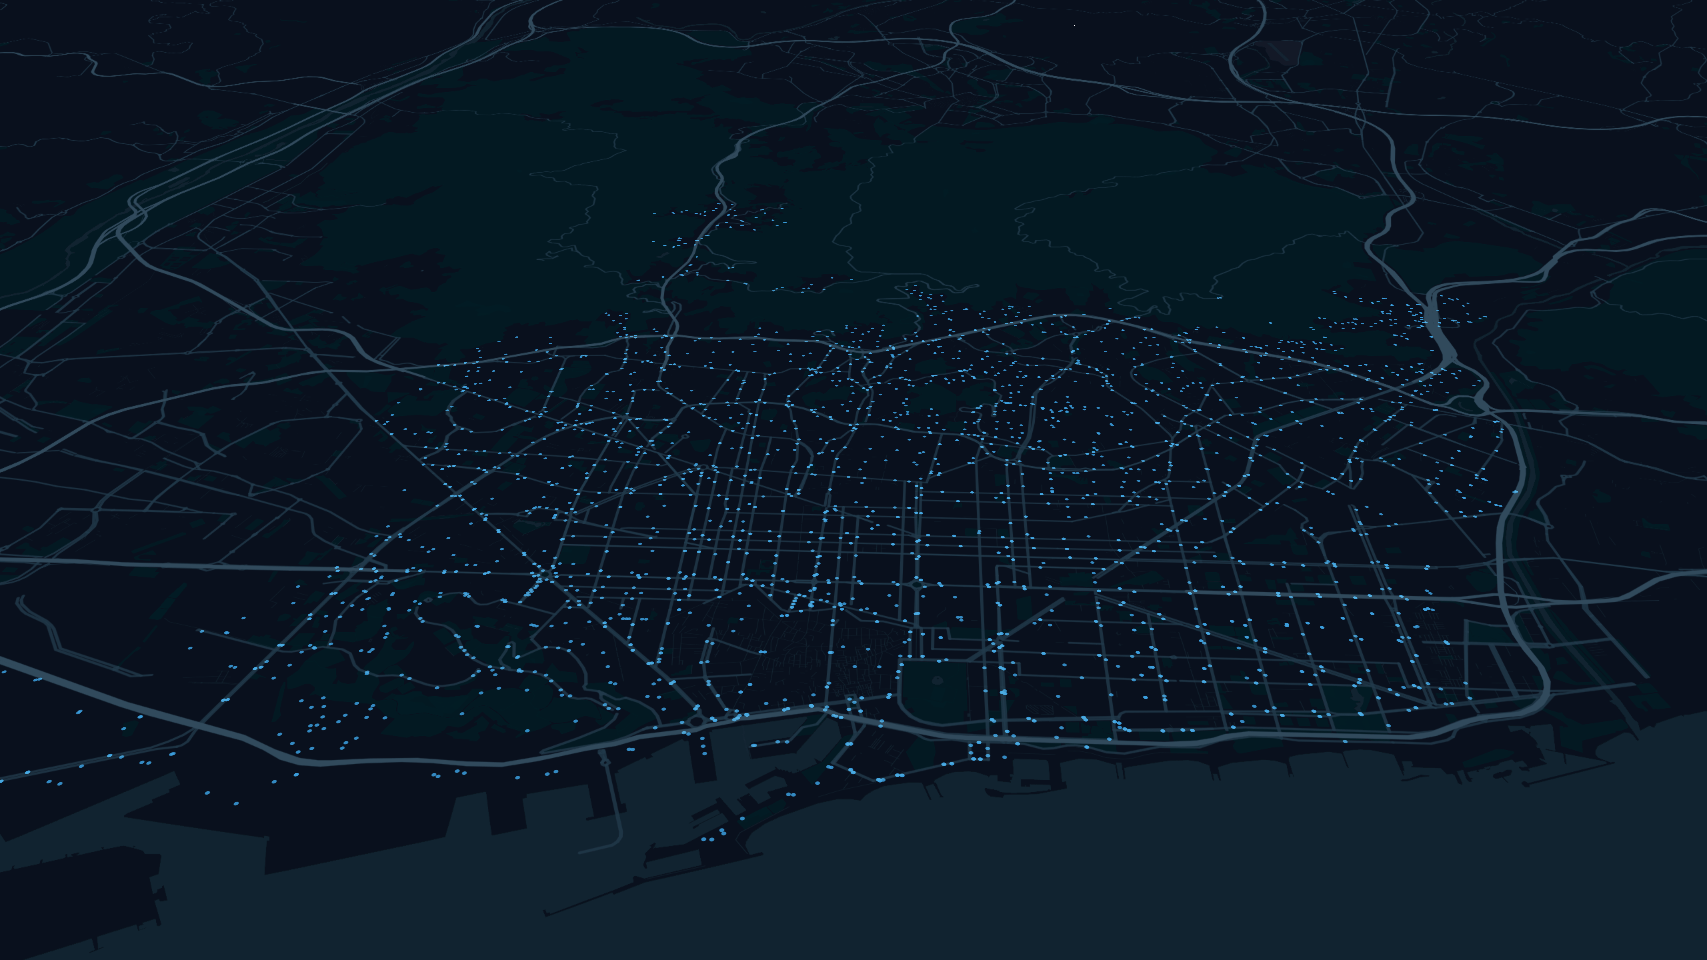
© Naveen Maria Fleming / ArchitectsWhoCode
Understanding Urban Justice
Urban justice refers to the fair distribution of resources, services, and opportunities across the urban environment. It is closely tied to ideas of equity, accessibility, and inclusion.
In practice, however, cities rarely function as balanced systems. Some neighborhoods benefit from dense networks of infrastructure frequent public transport, nearby schools, accessible healthcare, and abundant public spaces. Others experience limited access, requiring longer travel times, higher costs, or complete exclusion from certain services.
These disparities are not always immediately visible. They are often embedded within planning decisions, historical growth patterns, and economic structures. As a result, inequality becomes normalized part of the everyday functioning of the city.
The Role of Spatial Data
Spatial data provides a way to observe the city beyond anecdotal experience. By mapping the location of services and infrastructure, it becomes possible to identify patterns that are otherwise difficult to detect.
When multiple layers of urban data are brought together. such as transport networks, educational institutions, healthcare facilities, and public amenities a more comprehensive picture begins to emerge. Instead of isolated elements, we start to see relationships:
- Areas where services cluster densely
- Zones where access is limited or fragmented
- Overlaps that suggest redundancy in some regions and absence in others
Spatial visualization transforms abstract data into something interpretable. It allows us to ask questions not just about presence, but about proximity, distribution, and accessibility.
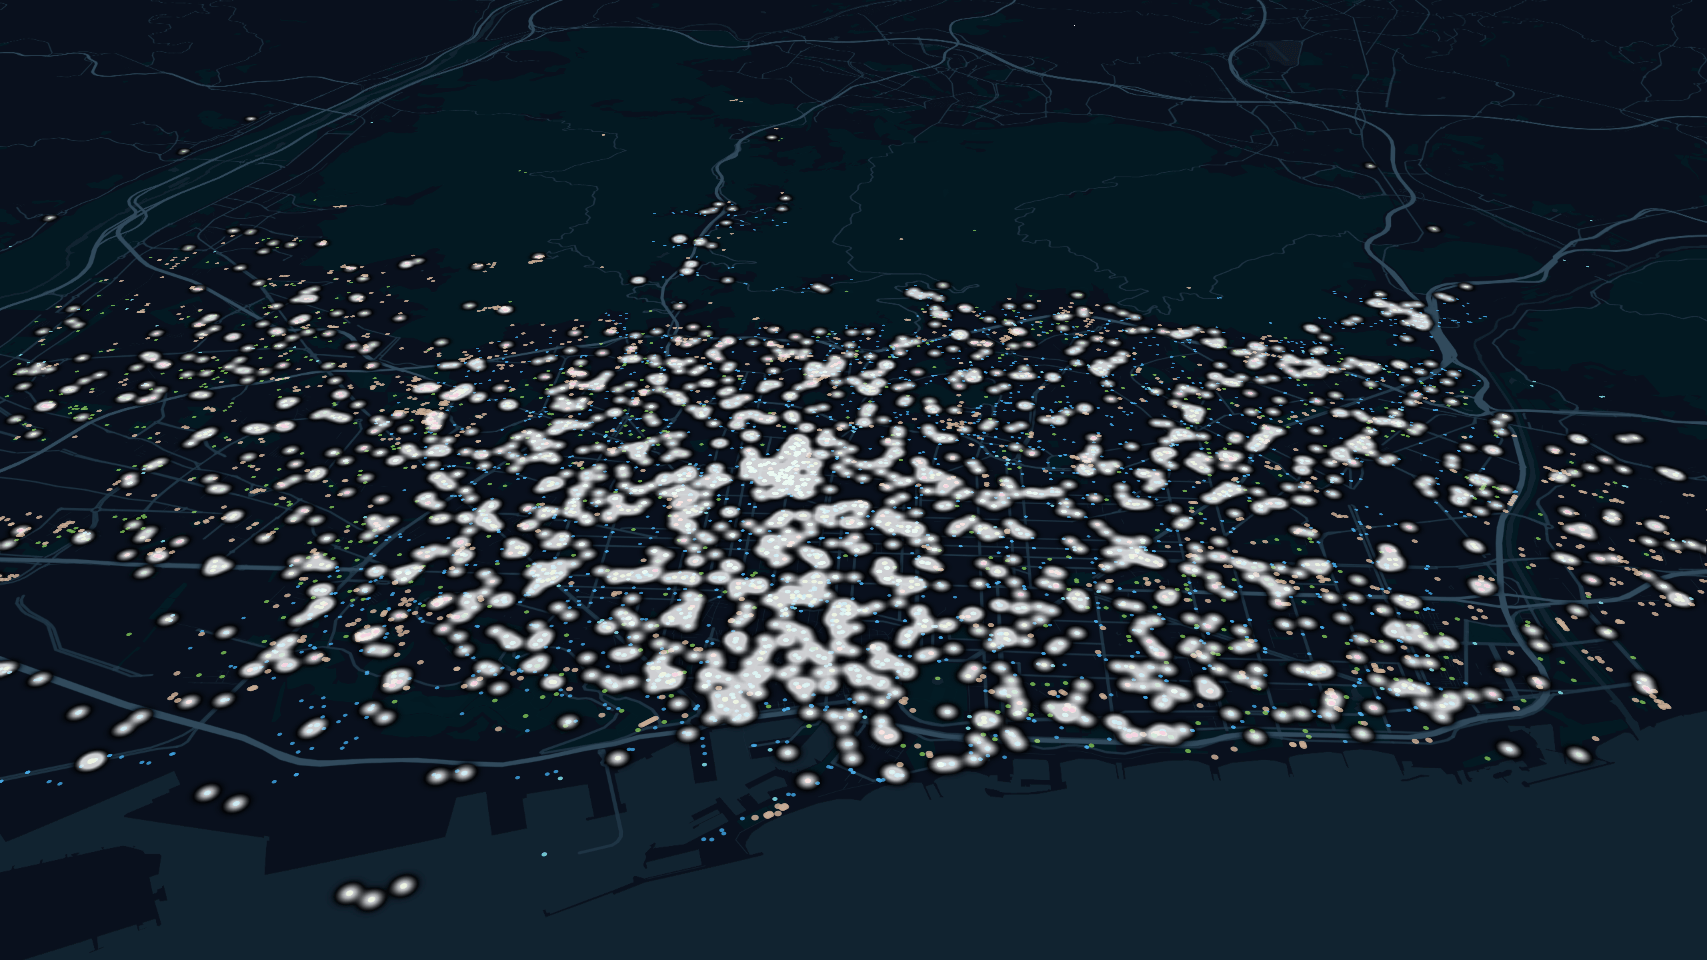
© Naveen Maria Fleming / ArchitectsWhoCode
From Visibility to Insight
However, simply mapping data is not enough. The goal is not to produce visually appealing representations, but to generate meaningful insight.
Patterns of concentration may indicate areas of high accessibility, but they may also reveal imbalance. where resources are disproportionately allocated. Conversely, areas with sparse distribution may highlight gaps that require attention.
Importantly, these patterns do not explain why inequality exists. Instead, they provide a starting point for investigation. Spatial data acts as a lens, revealing where to look more closely.
© Naveen Maria Fleming / ArchitectsWhoCode
Limitations
It is important to recognize the limits of spatial analysis.
The presence of a facility does not guarantee accessibility. Factors such as capacity, affordability, quality, and social barriers play a significant role. A hospital may exist within a short distance, but still remain inaccessible to certain populations. A park may be nearby, but not usable or safe.
Additionally, spatial data often simplifies complex realities. It reduces dynamic urban systems into static representations. Without contextual information. such as demographics or socio-economic conditions interpretations can be incomplete.
For this reason, spatial data should be understood as indicative, not definitive.
Conclusion
Urban justice cannot be fully measured through maps alone. But spatial data offers a powerful way to make hidden structures visible.
By examining how resources are distributed across space, we begin to see the city differently not just as a collection of buildings and infrastructure, but as a system of access and exclusion.
For architects, urban designers, and planners, this perspective is essential. It shifts the focus from designing isolated objects to understanding the broader systems in which they operate.
Spatial data does not provide all the answers. But it helps us ask better questions.
References
Harvey, D. (1973). Social Justice and the City. London: Edward Arnold.
Gehl, J. (2010). Cities for People. Washington, DC: Island Press.
Lefebvre, H. (1996). Writings on Cities. Oxford: Blackwell Publishing.
Soja, E. W. (2010). Seeking Spatial Justice. Minneapolis: University of Minnesota Press.
UN-Habitat. (2020). World Cities Report 2020: The Value of Sustainable Urbanization. Nairobi: United Nations Human Settlements Programme.
OECD. (2021). Access and Connectivity: Measuring Urban Accessibility. Paris: OECD Publishing.